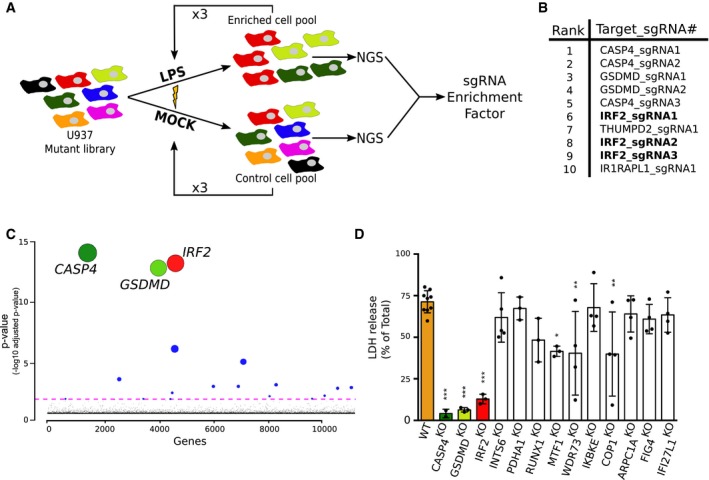
Figure 1. A genome‐wide CRISPR/Cas9 screen identifies IRF2, gasdermin D, and caspase‐4 as the three main players in LPS sensing.

- A genome‐wide CRISPR/Cas9 screen based on LPS electroporation was performed in U937 cells. Four successive electroporation rounds were performed. DNA was extracted from surviving cells, and next‐generation sequencing (NGS) was performed to calculate the sgRNA enrichment factor.
- The 10 most enriched sgRNA in the LPS‐electroporated samples are shown.
- Graphical representation of the screen results with each gene identified in the output libraries (10,750) represented on the x‐axis and the corresponding adjusted P‐value on the y‐axis. Statistical analysis was performed using the Wald test. The colored line represents the 0.05 P‐value threshold. The size of the circle is inversely proportional to the P‐value.
- U937 cell lines were knock‐out using CRISPR/Cas9, and cell death was quantified by LDH release assay 4 h after LPS electroporation. Each dot represents the average of three technical LDH replicates; means and SD of 3–9 independent experiments are shown. One‐way ANOVA with Dunnet's multiple comparisons test was performed. Adjusted P‐value is shown (from left to right ***P < 0.001, ***P < 0.001, ***P < 0.001, P = 0.84, P = 1, P = 0.092, *P = 0.012, **P = 0.0026, P = 1, **P = 0.0022, P = 0.98, P = 0.82, P = 0.97).
