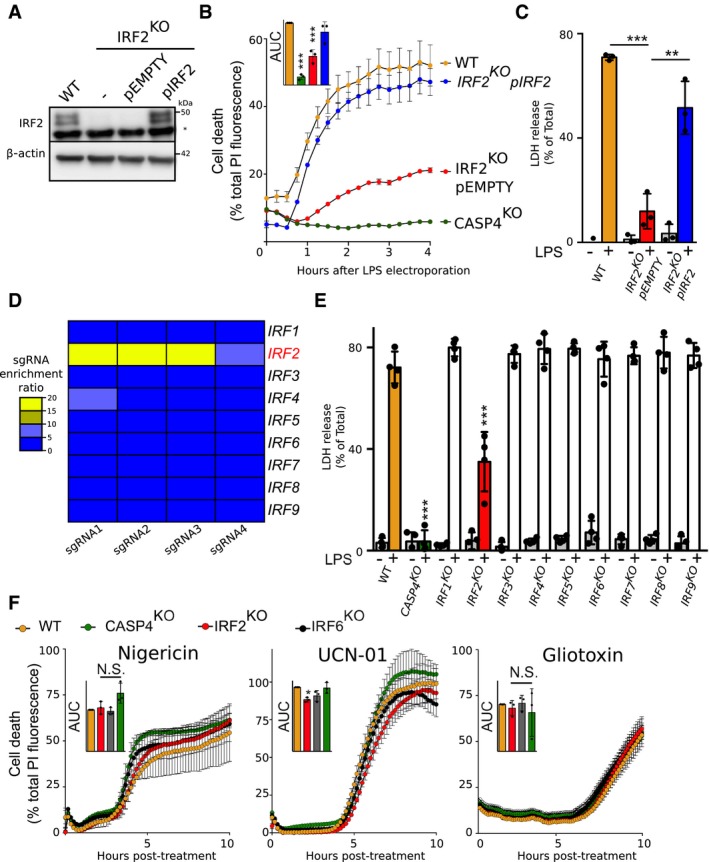
U937 cell lines were generated using CRISPR/Cas9.
IRF2 and β‐actin protein levels were assessed in the lysate of the indicated U937 cells by Western blotting analysis. A non‐specific band (*) is observed in the IRF2 Western blot. One experiment representative of three experiments is shown.
Cell death induced by LPS electroporation or the indicated treatment was quantified in real time by measuring propidium iodide (PI) incorporation/fluorescence every 15 min. Cell death was normalized using untreated and TX‐100‐treated cells. The kinetics of one representative experiment and the areas under the curve (AUC) (normalized to the WT AUC) of three independent experiments are shown. Each point represents the mean of a biological triplicate of one experiment; the bar represents the mean ± SD of three independent experiments.
Cell death was measured by LDH release assay 4 h after LPS electroporation. Each dot corresponds to the LDH triplicate of one experiment; the bar represents the mean ± SD of four independent experiments.
Heat map representation of the enrichment factor for the 4 sgRNA targeting each IRF in the genome‐wide screen.
Cell death was measured by LDH release assay 4 h after LPS electroporation. Each dot corresponds to the LDH triplicate of one experiment; the bar represents the mean ± SD of three independent experiments.
Cell death was quantified by measuring PI incorporation/fluorescence every 15 min after treatment with nigericin, UCN‐01, or gliotoxin. The kinetics of one representative experiment and the areas under the curve (AUC) (normalized to the WT AUC) of three independent experiments are shown. Each point represents the mean of a biological triplicate of one experiment; the bar represents the mean ± SD of three independent experiments.
Data information: (B, E and F) One‐way ANOVA with Dunnet's multiple comparisons test was performed. (B‐WT vs. CASP4
KO: ***
P < 0.0001, WT vs. IRF2
KO pEMPTY: ***
P = 0.0004, WT vs. IRF2
KO pIRF2:
P = 0.11; E‐left to right ***
P < 0.0001;
P = 0.36; ***
P < 0.0001;
P = 0.78;
P = 0.43;
P = 0.42;
P = 0.98;
P = 0.87;
P = 0.68;
P = 0.86; F‐ left to right, AUC Nigericin,
P = 0.95,
P = 0.98,
P = 0.027; AUC‐UCN‐01,
P = 0.012;
P = 0.066;
P = 0.99; AUC gliotoxin,
P = 0.97,
P = 1,
P = 0.79). (C) One‐way ANOVA with Sidak's multiple comparisons test was performed. (WT vs. IRF2
KO pEMPTY: ***
P = 0.0001, IRF2
KO pEMPTY vs. IRF2
KO pIRF2: **
P = 0.0014).
Source data are available online for this figure.

