-
A–C
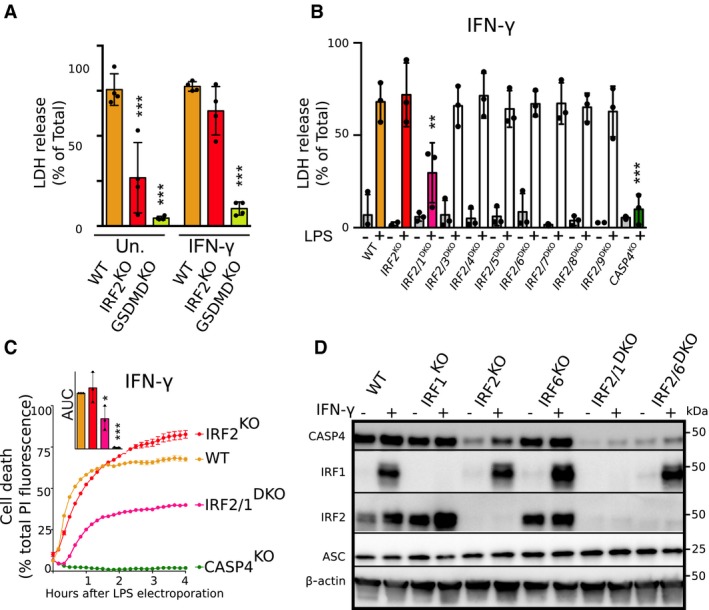
Cell death was assessed (A, B) by measuring LDH release 4 h after LPS electroporation or (C) by measuring propidium iodide (PI) incorporation/fluorescence every 10 min in the indicated U937 cell lines primed (A‐as indicated, B, C‐all samples) or not with IFN‐γ. (C) Cell death was normalized using untreated and TX‐100‐treated cells. One real‐time cell death experiment (mean and SD of triplicate) representative of three independent experiments is shown. The areas under the curve (AUC) (normalized to the WT AUC) of three independent experiments are shown. Each point represents the mean of a triplicate of one experiment; the bar represents the mean (and SD) of the three independent experiments.
-
D
Caspase‐4, IRF2, and IRF1 protein levels were assessed in the lysate of the indicated U937 cell lines primed or not with IFN‐γ. Data are representative of three independent experiments.
Data information: (A,B) Each dot corresponds to the mean of LDH triplicate of one experiment; the bar represents the mean ± SD of three (B) to four (A) independent experiments. (A): One‐way ANOVA with Sidak's multiple comparisons test was performed (untreated WT vs. IRF2
KO: ***
P < 0.0001, WT vs. GSDMD
KO: ***
P < 0.0001; IFN‐γ‐treated WT vs. IRF2
KO:
P = 0.3, WT vs. GSDMD
KO: ***
P < 0.0001). (B) One‐way ANOVA with Dunnet's multiple comparisons test was performed (All
P‐values = 1 except WT vs. IRF1/2
DKO: **
P = 0.0048 and WT vs. CASP4
KO: ***
P < 0.0001). (C) One‐way ANOVA with Dunnet's multiple comparisons test was performed (WT vs. IRF2
KO:
P = 0.84, WT vs. IRF1/2
DKO: *
P = 0.03, WT vs. CASP4
KO: ***
P = 0.0004).
Source data are available online for this figure.

