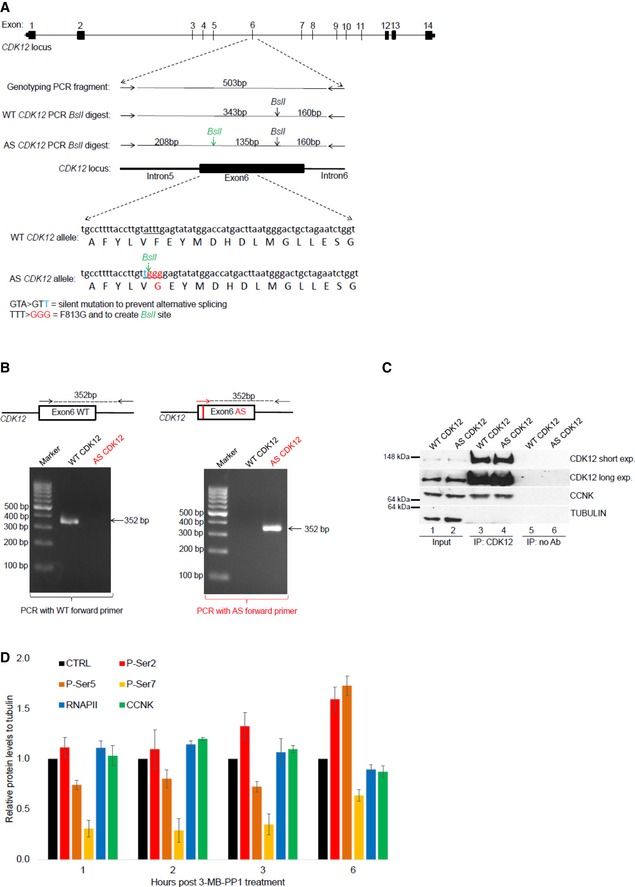
Figure EV1. Preparation and characterization of AS CDK12 HCT116 cell line.

- Depiction of CDK12 locus, genome editing, and genotyping strategy. Schema of CDK12 locus, with exon numbers shown above the CDK12 gene depiction (top). Primers used for genotyping PCR surrounding exon 6 of CDK12 gene are shown as horizontal arrows, PCR product is depicted as full horizontal line, and BslI restriction sites are indicated by vertical arrows. BslI restriction site created by genome editing is shown in green. Size (bp) of genotyping PCR product and BslI restriction fragments are indicated (middle). DNA subjected to genome editing and corresponding protein sequences in exon 6 of CDK12 genes are shown; the underlined DNA sequence in WT CDK12 allele underwent genome editing to create silent mutation preventing alternative splicing (nucleotide in blue), BslI restriction site, and to convert F813 to G813 (nucleotides in red) in AS CDK12. Engineered G813 in AS CDK12 is indicated in red (bottom).
- Characterization of AS CDK12 clone by a AS primer‐specific PCR. Exon 6 in CDK12 gene is shown as a black box. Edited DNA in the AS CDK12 is marked by a red vertical line in the exon 6. Genotyping primers specific for WT (black arrows) and AS CDK12 (red arrow) are shown, and genotyping PCR product is depicted by a dashed line with size (in bp) indicated above (top). Ethidium bromide‐stained agarose gel visualizing 352 bp PCR product from PCR mixture using either WT‐ (left) or AS‐specific (right) forward primer (bottom).
- CCNK/CDK12 complex shows comparable properties in the AS and WT CDK12 HCT116 cell lines. Western blot analysis of protein levels (input) and association [determined by immunoprecipitation (IP)] of CCNK and CDK12 in the indicated cell lines. No Ab corresponds to a control immunoprecipitation without antibody. A representative image of three replicates is shown.
- Quantification of individual P‐Ser modifications in the CTD of RNAPII after CDK12 inhibition. Amounts of individual proteins and CTD modifications presented in Fig 1D and in another two biological replicates from short film exposures were quantified by ImageJ software. All protein levels were normalized to a corresponding tubulin loading control, and samples without treatment in each time point (CTRL) were considered as 1; n = 3 biological replicates and error bars are standard error of the mean (SEM).
Source data are available online for this figure.
