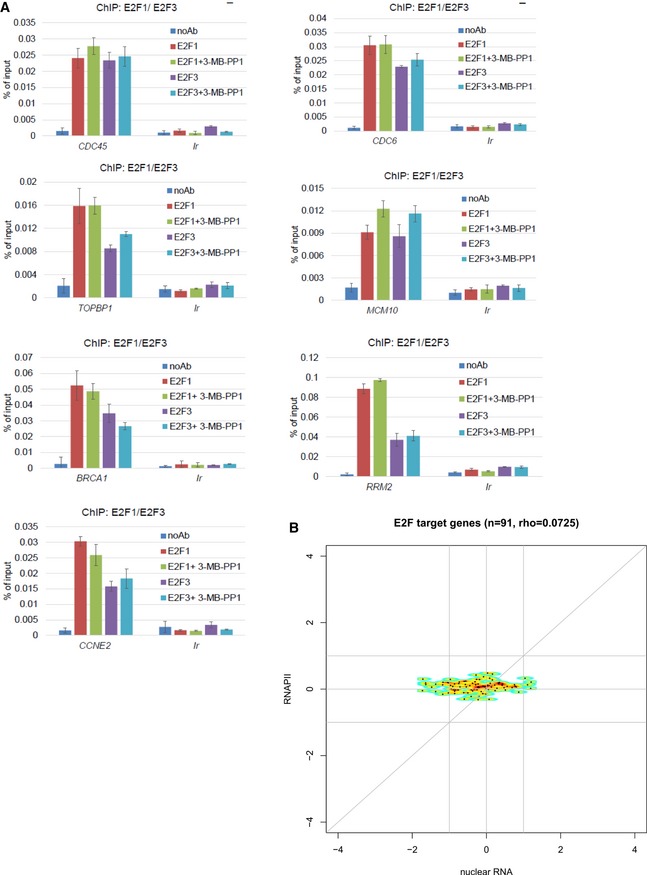
CDK12 inhibition does not lead to differential recruitment of RNAPII to E2F target genes. The plots show log2 fold‐changes of RNAPII occupancy on promoters of E2F target genes (
y‐axis) plotted against corresponding log2 fold‐changes in mRNA expression from nuclear RNA‐seq (
x‐axis). Promoter occupancy was quantified as read counts in the ±3 kb regions around the transcription start site (TSS). For each gene, we selected the transcript with the most read counts in the RNAPII ChIP‐seq samples (normalized to library size) in the ±3 kb regions around the TSS and transcription termination site (TTS). Corresponding RNAPII ChIP‐seq and nuclear RNA‐seq experiments are presented in Fig
5A and B. E2F target genes were obtained from Bracken
et al
40; rho = Spearman rank correlation coefficient.

