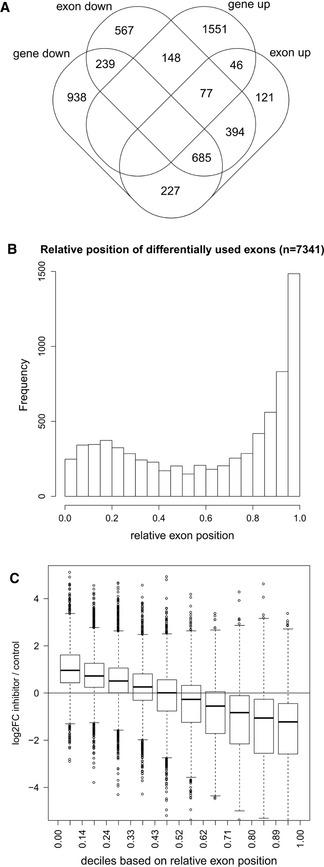
Figure 6. CDK12 inhibition results in transcript shortening of a subset of genes.

- Overlap between down‐regulated genes and genes with differential exon usage upon CDK12 inhibition. Venn diagram shows the overlap between significantly differentially expressed genes (identified by DESeq2) and genes with differential exon usage (identified by DEXSeq) in nuclear RNA‐seq data (0 > log2 fold‐change > 0, P < 0.01, restricted to genes included in the DEXSeq analysis).
- Differentially used exons are enriched at gene 3′ends. Graph shows the distribution of the relative genomic position of the exon on the gene (relative exon position: 0 = at gene 5′end, 1 = at gene 3′end) of differentially used exons (0 > log2 fold‐change > 0, P < 0.01).
- For down‐regulated genes with differentially used exons, exons close to the 5′end and 3′end tend to be up‐ and down‐regulated, respectively. Box plots show the log2 fold‐change in exon usage after CDK12 inhibition determined by DEXSeq. Exons were grouped into deciles according to their relative exon position. n = 3 replicates. The boxes indicate the range between the 25th and 75th percentile (=interquartile range (IQR)) around the median (thick horizontal line) of the distribution. The whiskers (=short horizontal lines at ends of dashed vertical line) extend to the data points at most 1.5 × IQR from the box. Data points outside this range are shown as circles.
