. 2019 Sep 3;16(5):361–368. doi: 10.21873/cgp.20141

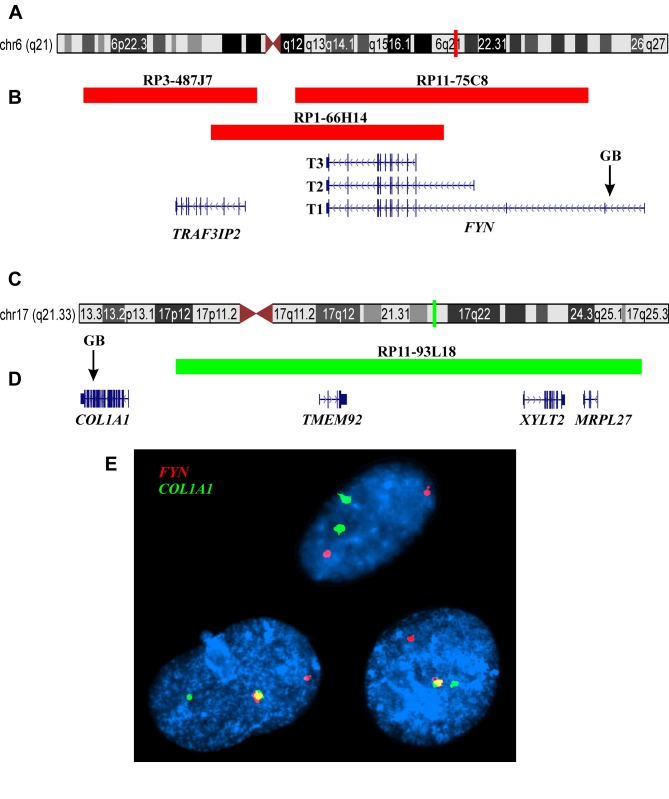
Figure 3. FISH analysis of epithelioid osteoblastoma using COL1A1 and FYN home-made dual-color single-fusion probe. (A) Ideogram of chromosome 6 showing the mapping position of the FYN gene (vertical red line). (B) Diagram showing the FISH probes RP3-487J7, RP1-66H14, and RP11-75C8 for FYN. Arrow indicates the genomic breakpoint (GP) in the intron 1 of FYN. The neighbor TRAF3IP2 gene in this region is also shown. (C) Ideogram of chromosome 17 showing the mapping position of the COL1A1 gene (vertical green light). (D) Diagram showing the FISH probe RP11-93L18 for COL1A1. The TMEM92, XYLT2, and MRPL27 genes mapped in this region, distal to COL1A1, are also shown. Arrow indicates the genomic breakpoint (GP) in the intron 43 of COL1A1. (E) FISH results with the FYN (red signal) and COL1A1 (green signal) probes on three interphase nuclei (composite photo) showing a red signal, a green signal, and one yellow-fusion signal in two nuclei and two green and two red signals in one nucleus.

Figure 3