. 2019 Sep 3;16(5):377–397. doi: 10.21873/cgp.20143

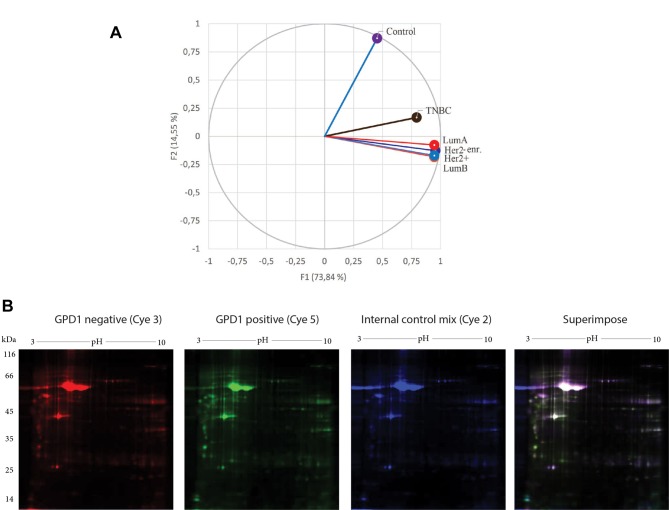
Figure 8. Principle component analysis (PCA) was performed using XLSTAT, an add-in software developed by Addinsoft. Average spot intensities were exported from the PDQuest Advance as tab delaminated Excel data (A). DIGE images of the pooled glycerol-3-phosphate dehydrogenase 1 (GPD1–) (Cye3) and pooled GPD1+ (Cye5) triple negative breast cancer (TNBC) samples. The internal control mix (Cye2), used for normalization, was formed by mixing equal amount of protein from the pooled GPD1+ and the pooled GPD1– TNBC samples. The superimposed image was the product of superimposing all three Cye dye images; images were pseudo coloured (B). Lum, Luminal.

Figure 8