. 2019 Sep 3;16(5):319–332. doi: 10.21873/cgp.20137

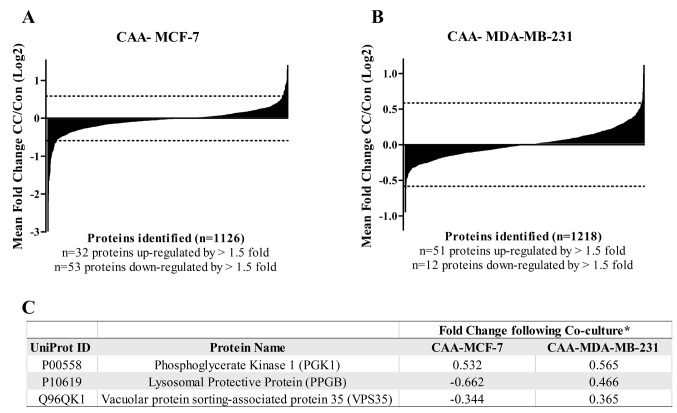
Figure 2. Distribution of iTRAQ ratios identified and quantified in co-culture compared to control. A and B: Waterfall plots showing the distribution of the average co-culture (CC) versus control ratios (log2) for all the proteins identified in CAA-MCF-7 cells (1,126 proteins) and CAA-MDA-MB-231 cells (1,218 proteins), respectively. Vertical black bars represent different proteins and horizontal dotted lines represent a fold change (FC) of 1.5 (log2). In MCF-7 cells n=85 and in MDA-MB-231 n=63 proteins were enriched by greater than 1.5-fold. Of these enriched proteins, n=53/85 were down-regulated in MCF-7, whereas n=51/63 proteins were up-regulated by more than 1.5-fold in MDA-MB-231 cells. C: The three proteins identified and quantified to be differentially abundant by 1.5-fold or greater in both CAA-MCF-7 and CAA-MDA-MB-231 cells after co-culture with CAA. *FC values are the log of the average CC/control ratios.

Figure 2