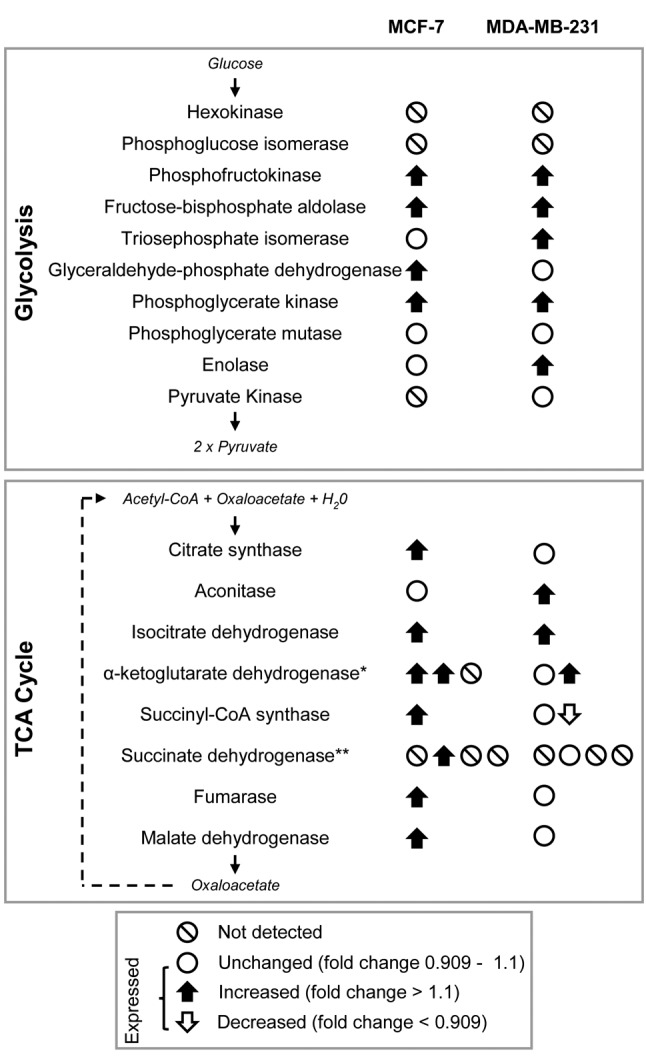
Figure 4. MCF-7 and MDA-MB-231 breast cancer cells up-regulate enzymes of glycolysis and TCA cycle after co-culture with CAA. iTRAQ LC-MS/MS protein abundance data and bioinformatic analysis indicates an enriched up-regulation of TCA cycle and glycolysis pathway proteins in MCF-7 and MDA-MB-231 breast cancer cells after co-culture with CAA. Up and down arrows represent enzymes with abundance changes greater than 10%, and the direction of regulation (increased or decreased) compared to control breast cancer cells. White circles show enzymes that were detected, but not differentially regulated following co-culture. White circles with black lines are enzymes undetected in this study. *Complex comprising three subunits: OGDH, DLST and DLD, respectively. **Complex comprising four subunits: SDHAF2, SDHB, SDHC and SDHD, respectively. Complex subunits are gene names as reported by UniProtKB.

