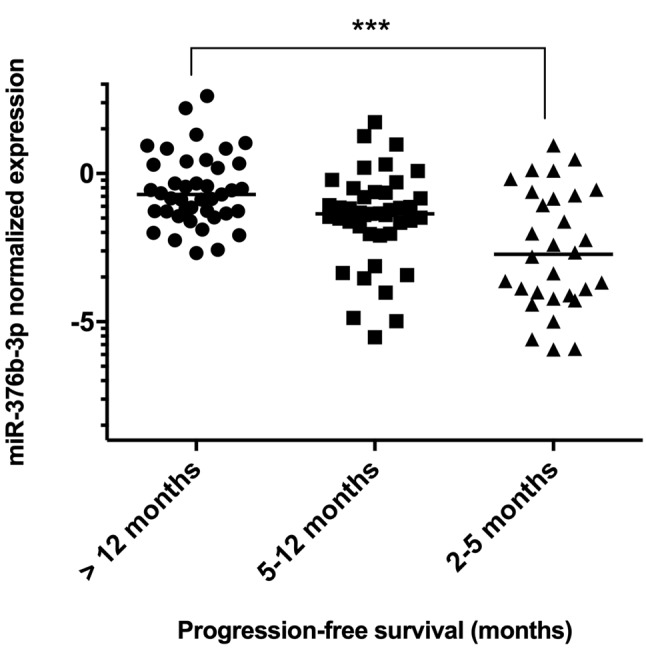
Figure 2. MiR-376b-3p expression levels in tumors of patients with primary resistance (PFS=2-5 months, N=30), intermediate response (PFS 5-12 months, N=42) and long-term response to sunitinib therapy (PFS >12 months, N=42). (Kruskall–Wallis test; p=0.0003). Comparison only between patients with primary resistance and long-term response (Mann–Whitney test; ***p=0.0001).

