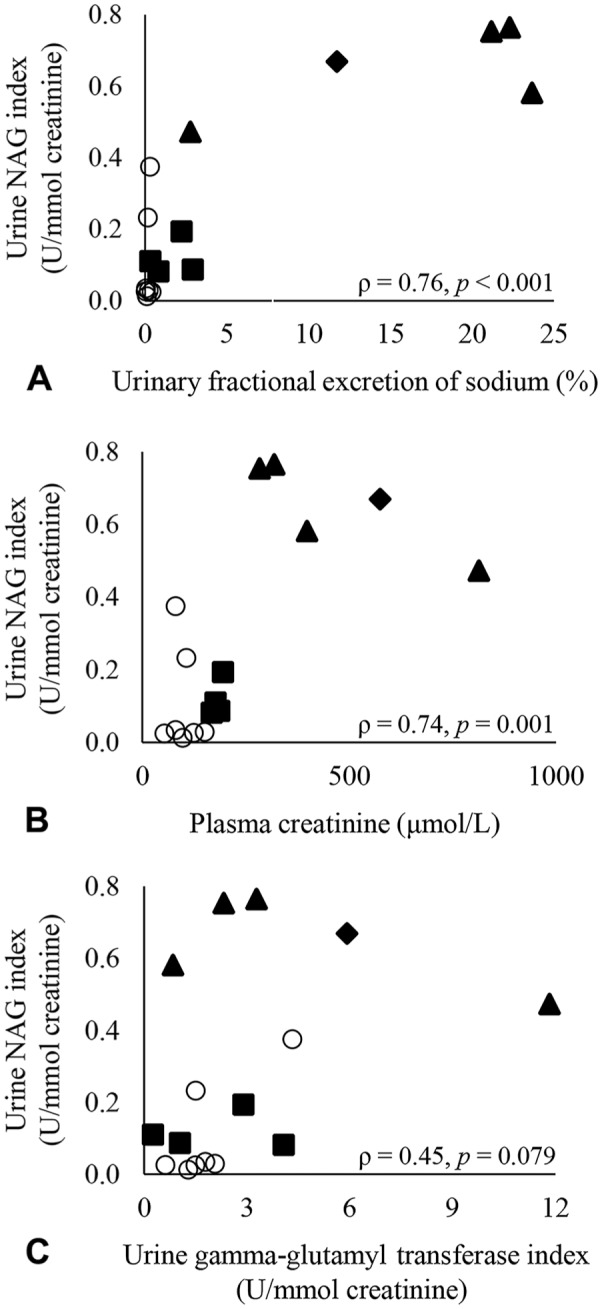
Figure 1.

Correlation of urine N-acetyl-β-D-glucosaminidase (NAG) index with A. urinary fractional excretion of sodium, B. plasma creatinine, and C. urine gamma-glutamyl transferase index. Each sample (group N: n = 7 samples; group A: n = 9 samples) is represented by a data point. Group N (non-azotemic) is represented by open circles. Group A (azotemic) is shown in solid markers and is subdivided based on suspected origin of azotemia (suspect renal azotemia = solid triangle; suspect prerenal azotemia = solid square; unknown origin azotemia = solid diamond).
