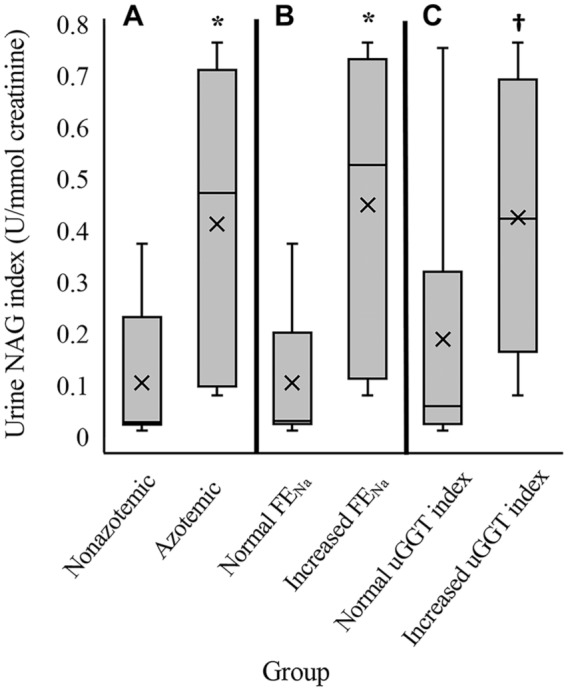
Figure 2.

Box-and-whisker plots of urine N-acetyl-β-D-glucosaminidase (NAG) indices for samples divided into groups by A. non-azotemic (n = 7 samples) versus azotemic (n = 9 samples), B. normal urinary fractional excretion of sodium (FENa; n = 8 samples) versus increased FENa (n = 8 samples), and C. normal urine gamma-glutamyl transferase (uGGT) index (n = 10 samples) versus increased uGGT index (n = 6 samples). Horizontal lines = median and quartiles. Whiskers = range of data; × = mean; * = p < 0.01; † = p < 0.05.
