Figure 5.
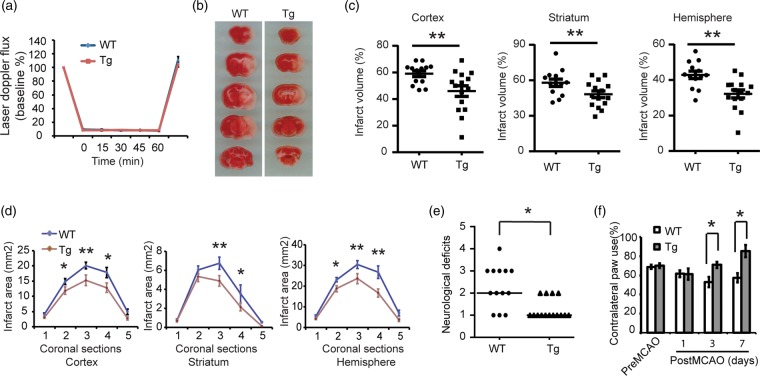
Overexpression of Thorase protects against neuronal injury following stroke. (a) Laser-Doppler flux measured over the lateral parietal cortex in the core of the ischemic region in WT (n = 13) and Thorase transgenic mice (Tg) (n = 13) mice. Values are means ± SEM, expressed as a percentage of the preischemic baseline values. (b) Representative images of TTC staining of brain slices from Thorase Tg and WT littermate controls subjected to 60 min of MCAO. (c) Quantification of infarct volumes in the cortex, striatum and whole hemisphere after 60 min of MCAO in WT and Thorase-Tg mice. Data are expressed as a percentage of the entire ischemic hemisphere and are means ± SEM. *p < 0.05 from WT by Student's t-test. (d) Quantification of infarct area among the five coronal levels (level 1 is most anterior) after 60 min of MCAO in WT and Thorase-Tg mice. Data represent the mean ± SEM, *p ≤ <0.05 and **p < 0.01 from WT by ANOVA with Tukey–Kramer's post hoc test. (e) Spontaneous neurobehavioral activity following MCAO was assessed on a scale of 0-4 (0 no neurological deficit, 4 severe neurological deficit). Data represent the median/range, *p < 0.05 determined by using a one-tailed Wilcoxon Mann–Whitney U-test for non-parametric rank-sum analysis. (f) Forelimb functional recovery assessed by the percent use of the contralateral (left) limb paw touch scored by an observer blind to the treatment and genotype. Data represent mean ± SEM, *p < 0.05 by ANOVA with Tukey–Kramer's post hoc test.

