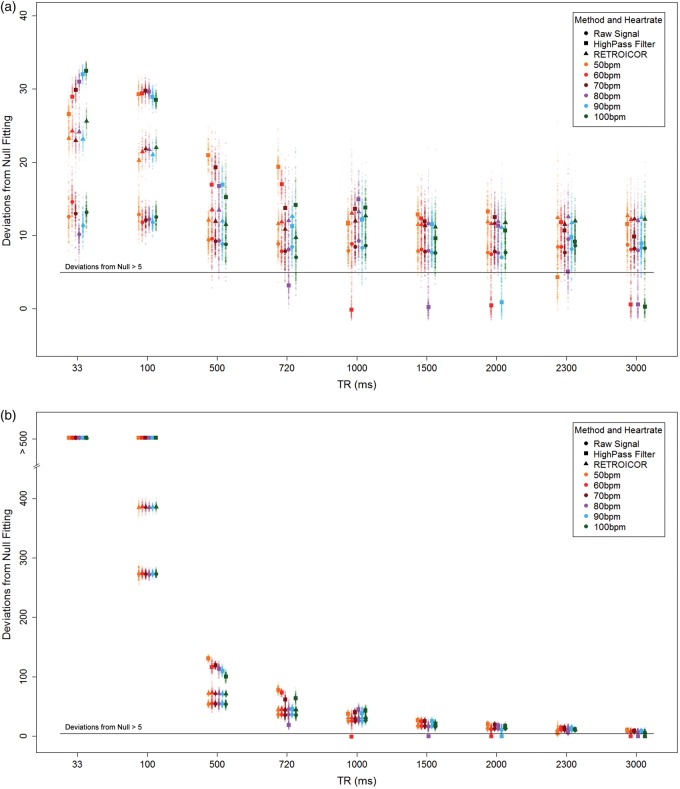
Figure 5.
(a) BOLD pulsatility deviations from null for each simulated scenario, plotted according to heart rate, TR and data cleaning method: uncorrected, high-pass filter and RETROICOR. (b) The simulation results show a dramatic TR dependence when the number of volumes at each TR is not held constant. Larger markers indicate means for each scenario.

