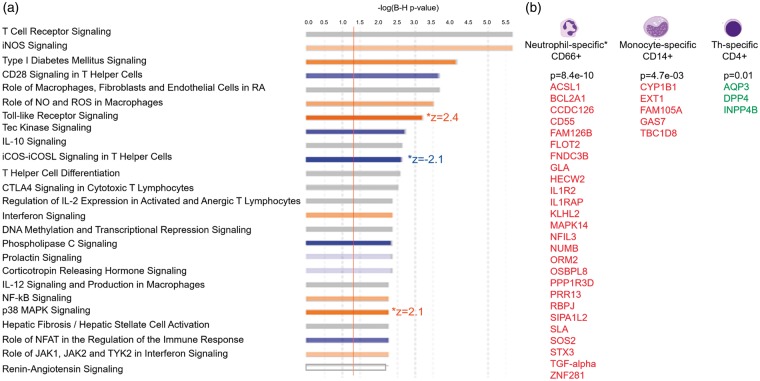
Figure 2.
Over-represented canonical pathways (a, top 25 pathways) and differentially expressed transcripts from cell type – specific genes (b) in ICH versus CTRL. (a) The X-axis represents negative log10 (Benjamini-Hochberg corrected p-value). −log10 (Benjamini-Hochberg corrected p-value) > 1.3 corresponds to Benjamini-Hochberg corrected p-value < 0.05. Orange bars represent predicted activation of the pathway, blue bars – predicted inhibition of the pathways, grey bars – direction cannot be predicted. Pathways having significant Z-scores for activation (Z > 2) or for inhibition (Z < −2) are denoted to the right of the pathway bar. (b) DET of cell-type specific genes in the 489 DET from ICH versus CTRL analysis. P-values represent the hypergeometric probability of overlap between our DET list (by gene symbol) and the list of cell-type specific genes from the HaemAtlas.27 Red – genes with upregulated DET (expressed higher in ICH than in CTRL); green – genes with down-regulated DET (expressed lower in ICH than in CTRL).

