Figure 6.
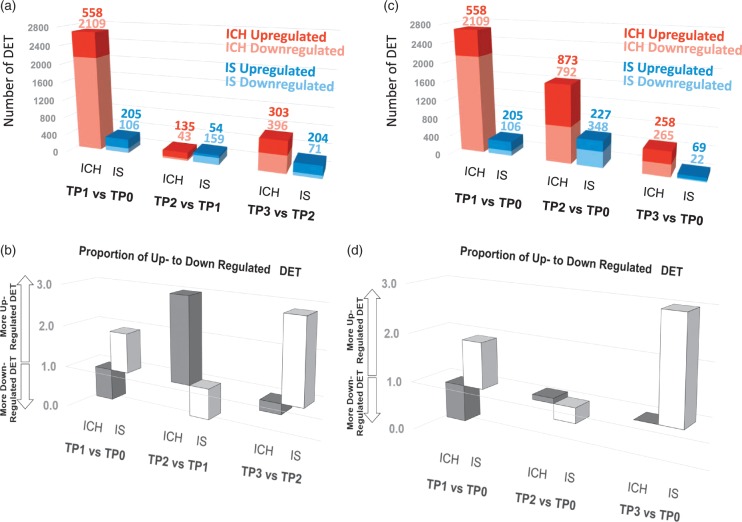
Dynamic changes in transcript expression in ICH and IS. TP0 indicates time-point 0 (CTRL), TP1 indicates time-point 1 (ICH or IS at < 24 h post event), TP2 indicates time-point 2 (ICH or IS between 24 h and 48 h post event) and TP3 indicates time-point 3 (ICH or IS > 48 h post event). A. number of DET between two consecutive time points. (b) Proportion of up- to down-regulated DET between two consecutive time points. (c) Number of DET between each ICH and IS time point and CTRL (as TP0). (d) Proportion of up- to down-regulated DET between each ICH and IS time point and CTRL (as TP0).

