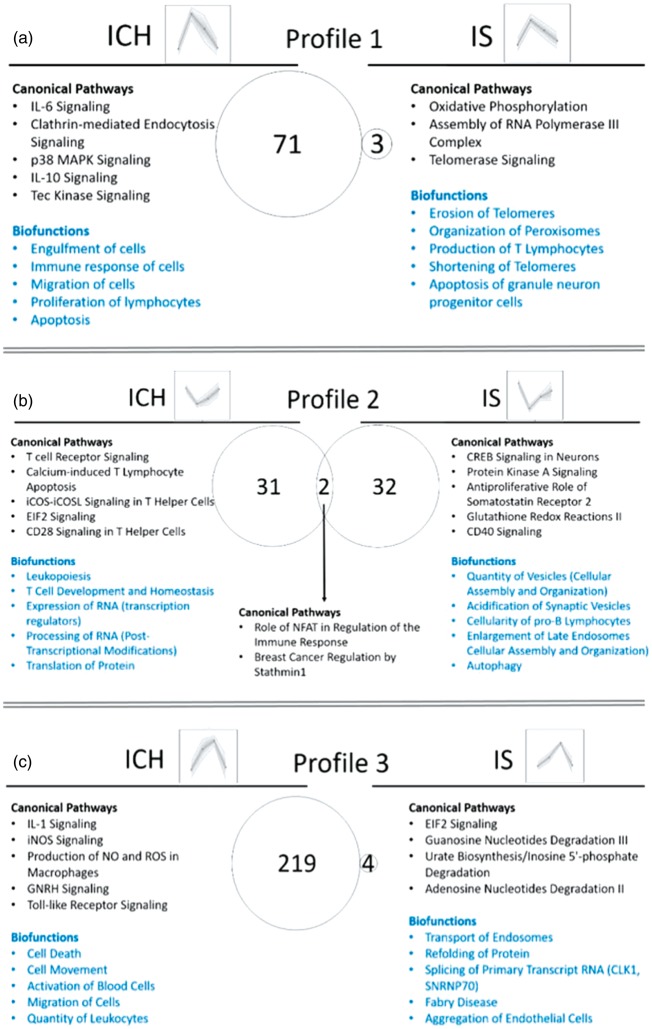
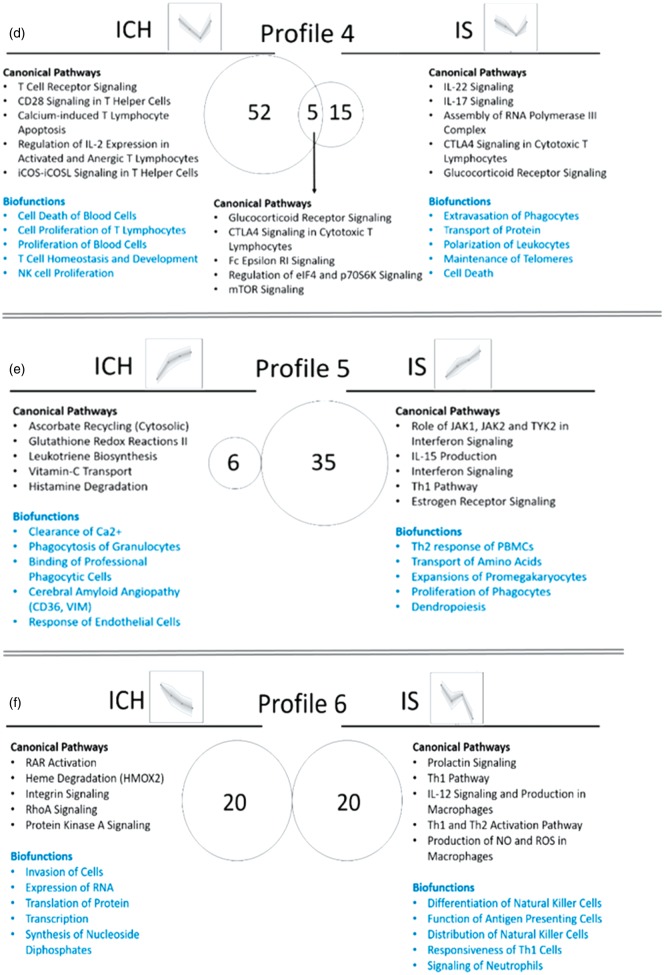
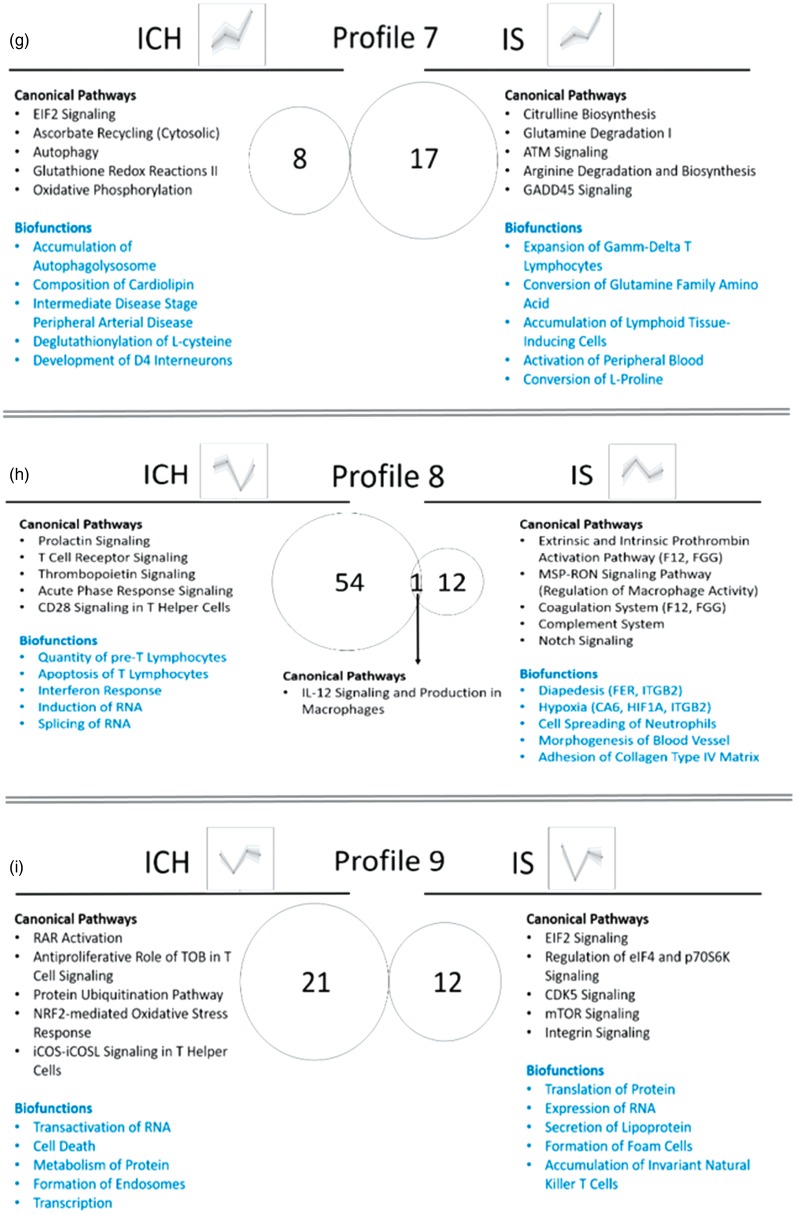
Figure 7.
Biological interpretation of the time-dependent profiles of ICH and IS (Profiles 1–9; Profile 10 is presented in Supplementary Figure 8). Venn diagram displays the number of canonical pathways over-represented in each of the time-dependent profiles. The top five relevant canonical pathways and top five relevant biofunctions are listed. (a) Profile 1; (b) Profile 2; (c) Profile 3; (d) Profile 4; (e) Profile 5; (f) Profile 6; (g) Profile 7; (h) Profile 8; (i) Profile 9.


