Figure 1.
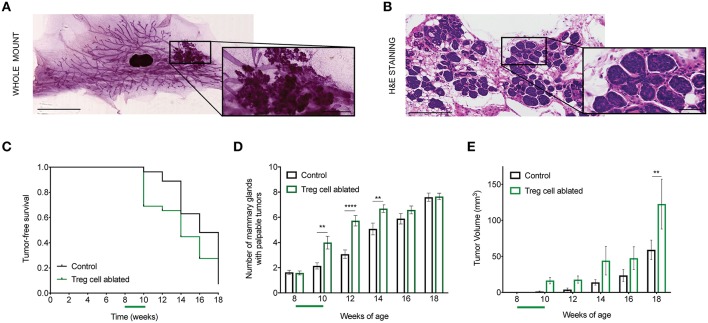
Treg cell ablation accelerates primary tumor growth. (A,B) Representative mammary gland whole mount (A) and section stained with H&E (B) from 8-week-old MMTV-PyMT mouse. Amplified region depicts tumor area (A) and hyperplasia/adenoma pre-invasive stage (B), respectively. Scale bars represent 5 mm and 1 mm (lower and higher magnification, respectively; whole mount) as well as 250 and 50 μm (lower and higher magnification, respectively; H&E stain). (C) Tumor-free survival curve (D), number of mammary glands with palpable tumors, and (E) tumor growth kinetics in Treg cell-ablated mice compared with control mice (n = 30–33 mice). **p = 0.006; ****p < 0.0001 (D) and **p = 0.0075 (E). Values are expressed as mean ± SEM and p-values were calculated using two-way ANOVA, followed by Bonferroni's post-hoc test. Green bar on the x axis indicates period of Treg cell ablation. Data were pooled from two independent experiments.

