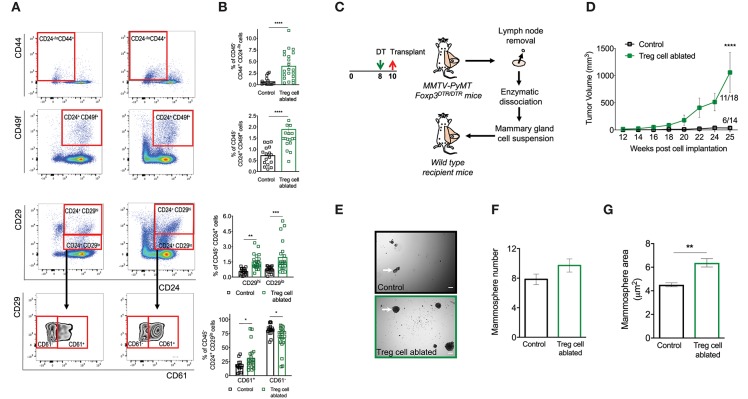
Figure 3.
Ablation of Treg cells results in expansion of the mammary cancer stem/progenitor cell pool. (A,B) Representative flow cytometric plots (A) and quantification (B) of stem cell like-populations (CD24−/lo CD44+, CD24+ CD49f+, CD24+ CD29hi) and luminal progenitor-enriched population (CD24+ CD29lo) of Treg cell-ablated and control mice. Gating on the luminal progenitor-enriched population, we compared immature (CD61+) and differentiated luminal progenitors (CD61−) between both groups (bottom). Indicated cell populations highlighted with red frames. Values are expressed as mean ± SEM, control n = 11, Treg cell ablated n = 12, ****p < 0.0001, and was calculated by Mann-Whitney test. **p = 0.0045; ***p = 0.0003; *p = 0.0237; *p = 0.0219 was calculated by two-way ANOVA, followed by Bonferroni's post-hoc test. Data were pooled from four independent experiments. (C,D) Schematics (C) and tumor growth kinetics (D) of mice orthotopically transplanted with dissociated mammary epithelial cells. Values expressed as mean ± SEM. ****p < 0.0001 by two-way ANOVA, followed by Bonferroni's post-hoc test (D). (E–G) In vitro mammosphere forming capacity of CD45 depleted-mammary cells. Representative images (E), mammosphere number (F) and area (G) of control (black) and Treg cell-ablated (green) conditions (n = 16 and n = 13, respectively). Arrow depicts a representative mammosphere in each image. Scale bar represents 200 μm. Values are expressed as mean ± SEM. **p = 0.0069 was calculated by Mann-Whitney test. Data were pooled from five independent experiments.

