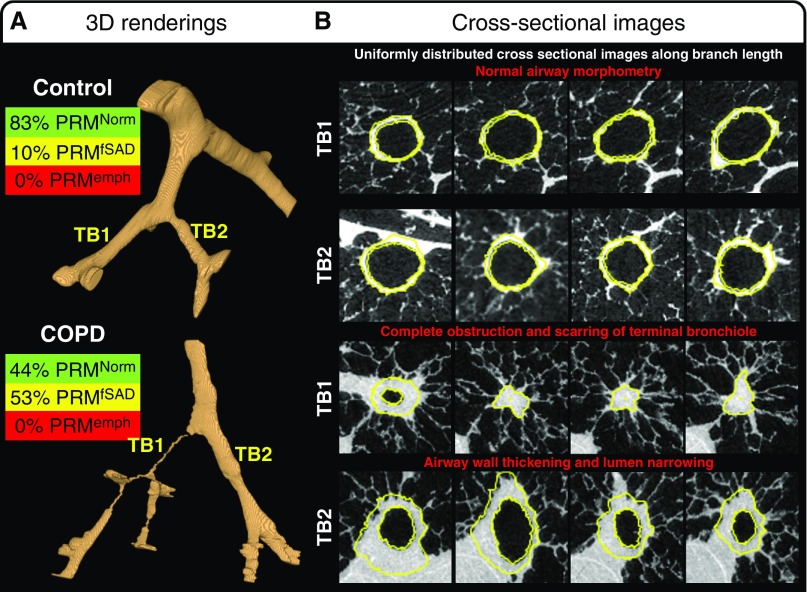
Figure 2.
Three-dimensional (3D) renderings of representative small airway trees present in tissue samples extracted from control subjects and patients with chronic obstructive pulmonary disease (COPD). (A) Representative 3D segmentation of all visible airways within a control and COPD sample are provided in addition to the matched parametric response mapping (PRM) analysis from the ex vivo computed tomography scan. (B) The cross-sectional images along the terminal bronchiole (TB) branch length demonstrate normal airway morphology in TB1 and 2 of the control sample compared with the COPD sample, which demonstrates complete obstruction and scarring in TB1 and airway wall thickening and lumen narrowing in TB2. Yellow lines indicate the inner and outer wall segmentations used for the calculations of luminal cross-sectional area, inner and outer wall perimeter, wall thickness, and wall area percentage. Cross-sectional images are 900 μm wide. emph = emphysema; fSAD = functional small airways disease; Norm = normal.

