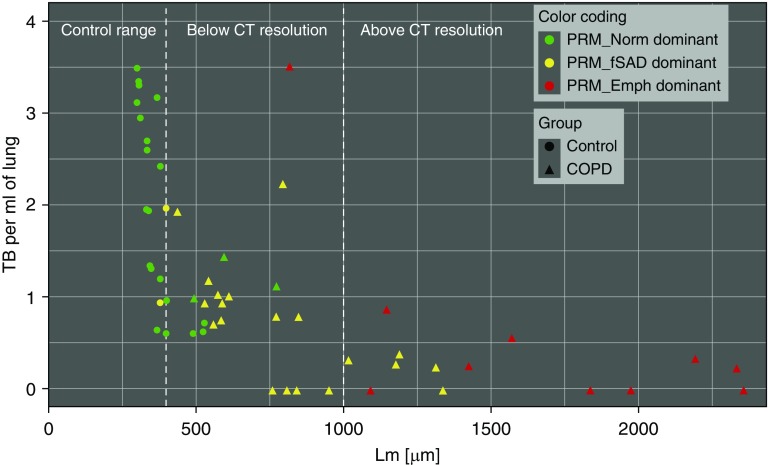
Figure 3.
Relationship between parametric response mapping (PRM) classification, number of terminal bronchioles (TBs), and airspace size. Samples are color coded based on predominant PRM abnormality (≥33.3%) PRMNorm (normal; green), PRMfSAD (functional small airways disease; yellow), or PRMEmph (emphysema; red), and by specimen type (control, circle; chronic obstructive pulmonary disease [COPD], triangle). Plot demonstrates that the majority of COPD lung samples dominant for PRMfSAD had significantly reduced number of TBs and a mean linear intercept (Lm) value greater than the 95th percentile of controls. COPD lung samples that were PRMEmph dominant had similar reduction in TB number but Lm greater than 1,000 μm, which is the lower limit of resolution for clinical computed tomography (CT) and therefore presents as detectable emphysematous disease.

