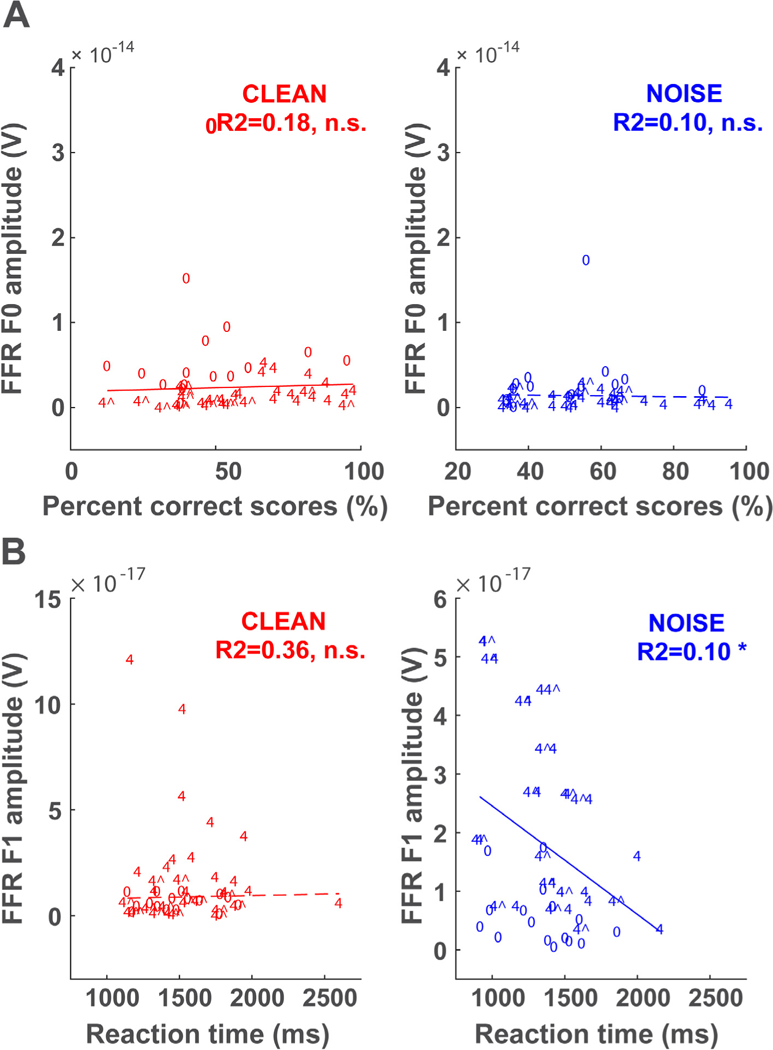
Fig. 5.

Brain-behavior correlations underlying double-vowel perception. Scatter plots and linear regression functions showing the relationship between (A) FFR F0 amplitudes and behavioral accuracy and (B) FFR F1 amplitudes and behavioral RTs for clean and noise-degraded speech. Data points are labeled according to each condition (‘0’ = 0ST; ‘4^’ = 4ST @ 150 Hz; ‘4’ = 4ST @ 190 Hz). *p < 0.05, n.s. − non-significant.
