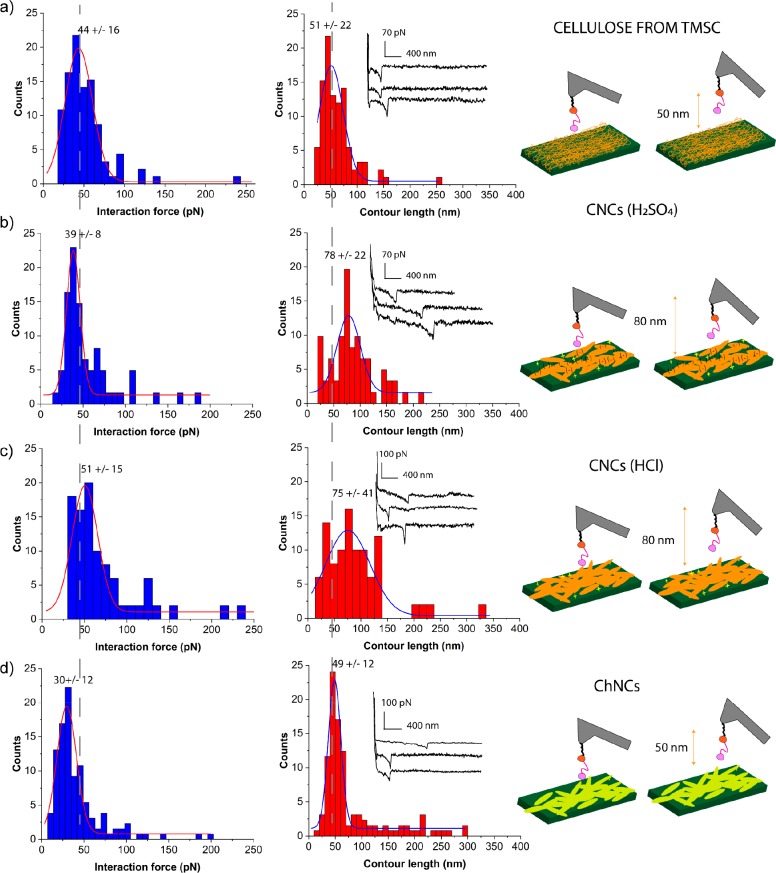
Figure 3.
Histograms representing the binding interaction force (blue bars) and the contour length (red bars) respectively for cellulose from TMSC (n = 96) (a), cellulose nanocrystals (CNCs) from sulfuric acid hydrolysis (n= 64) (b), cellulose nanocrystals (CNCs) from hydrochloric acid hydrolysis (n=57) (c), Chitin nanocrystals (ChNCs) (n=129) (d). Additional FD curves on CNC showing multiple rupture events in which not a single molecule but more detachment events happen, are excluded from the analysis as well as the ones in which the fit was not perfectly applicable. Histograms summing such curves to the one here presented are reported in Figure SI 4. Dotted grey lines are used as a guide to the eye for pointing out the differences between the obtained values in respect to the TMSC sample. On the right: Schematic representation of the SMFS experiment for each system studied.

