Figure 5.

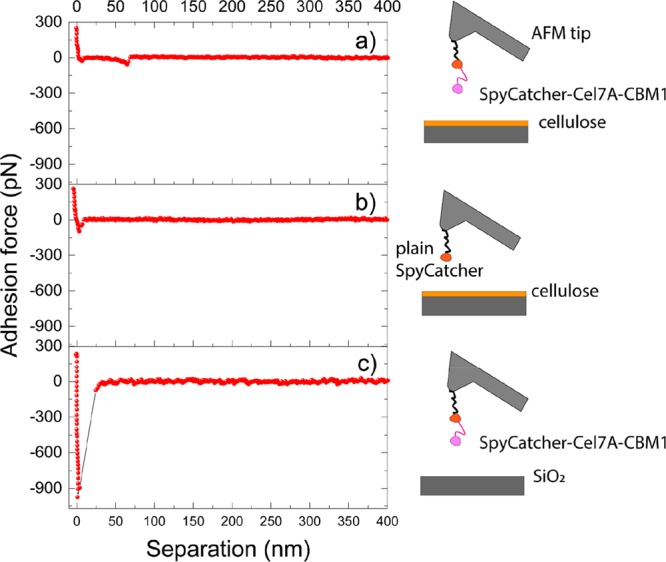
Fd curves with the related schematic representing the interaction between SpyCatcher-Cel7A-CBM1 and cellulose (a), plain SpyCatcher and cellulose (b), and SpyCatcher- Cel7A-CBM1 and SiO2 (c)..

Fd curves with the related schematic representing the interaction between SpyCatcher-Cel7A-CBM1 and cellulose (a), plain SpyCatcher and cellulose (b), and SpyCatcher- Cel7A-CBM1 and SiO2 (c)..