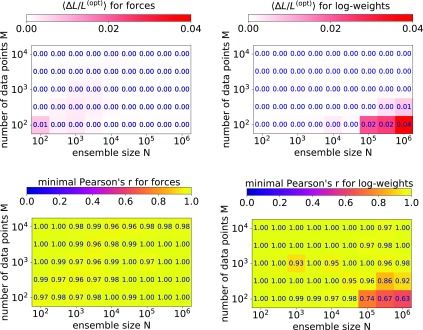
Figure 3.
Optimality of solutions as a function of the ensemble size N (horizontal axis) and number of experimental data points M (vertical axis) with respect to the most optimal solutions found with different convergence criteria and line search algorithms. (top) Difference of negative log-posterior values to optimum for the forces method (left) and the log-weights method (right). (bottom) Minimum value of the Pearson correlation coefficient r over the four samples at a given (M, N) with respect to the optimal weights for the forces method (left) and log-weights method (right).

