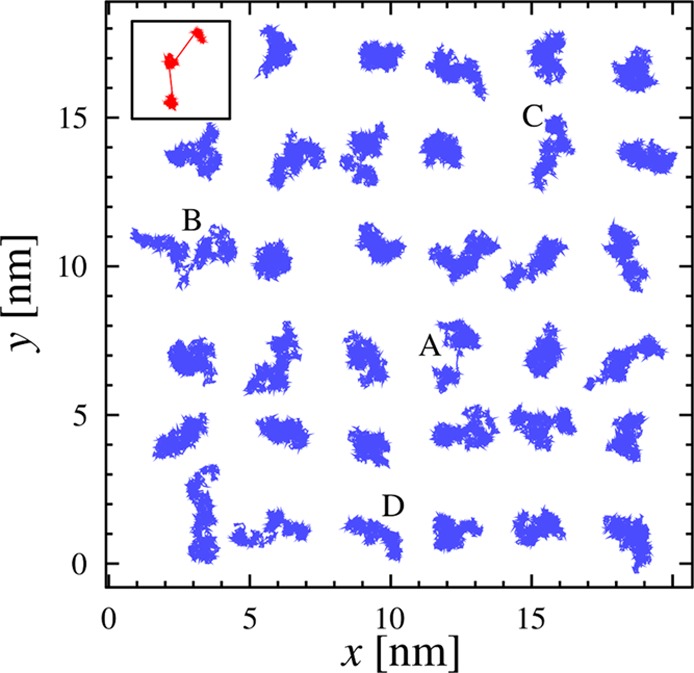
Figure 24.

Examples of center of mass trajectories for selected lipids in the plane of a DPPC bilayer, showing the last 30 ns of the simulation. The red inset (top left) highlights an example of how a trajectory is expected to look like if the diffusion were jump-dominated. The diffusion of lipids marked with A–D are discussed further in Figure 25. Adapted with permission from ref (616). Copyright 2008 American Chemical Society.
