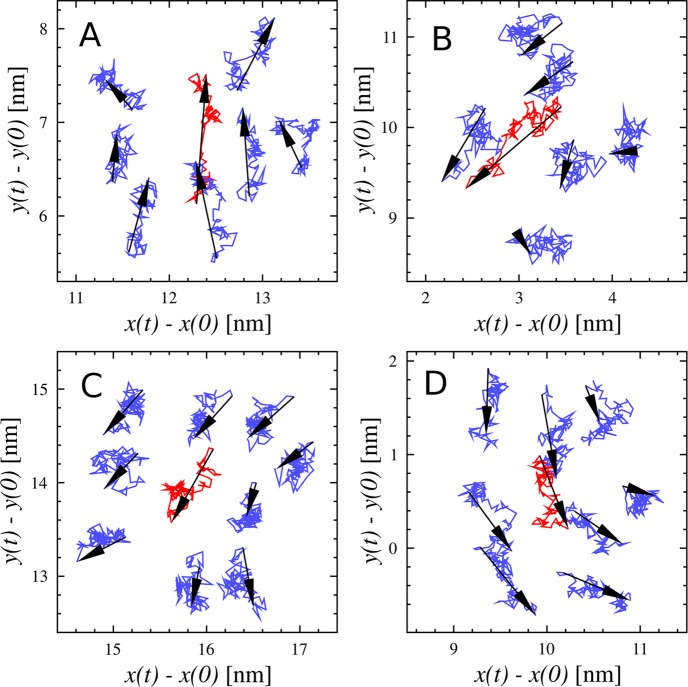
Figure 25.
Trajectories of selected lipids and their immediate neighbors during 1 ns time intervals. The red trajectory in each panel is part of the trajectory labeled A, B, C, or D in Figure 24. For each lipid, the 1 ns interval was chosen to be the one during which the lipid migrated the longest distance during the simulation. The blue trajectories are those of the nearest neighbors, which in practice are the lipids whose centers of mass are within 1 nm of that of lipid A, B, C, or D at any time during the 1 ns period. The black arrows indicate the total displacements during the 1 ns period. Adapted with permission from ref (616). Copyright 2008 American Chemical Society.

