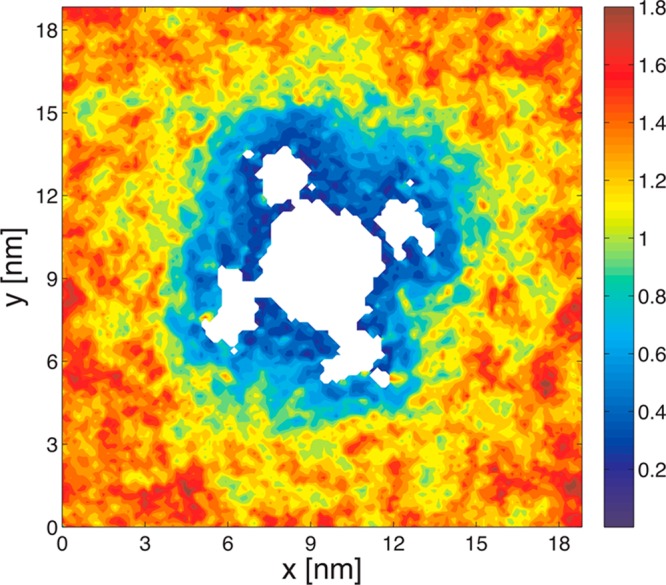
Figure 26.

Mean lateral displacements of lipids in one of the two membrane leaflets over a time scale Δt = 50 ns. The protein is shown in white, and its center of mass is centered. The scale bar on the right indicates dark blue to be characterized by very slow diffusion, and dark red to correspond to fast lateral diffusion. The blue region around the protein highlights the slowed-down lipids that move together with the protein in a concerted fashion. Adapted with permission from ref (16). Copyright 2010 American Chemical Society.
