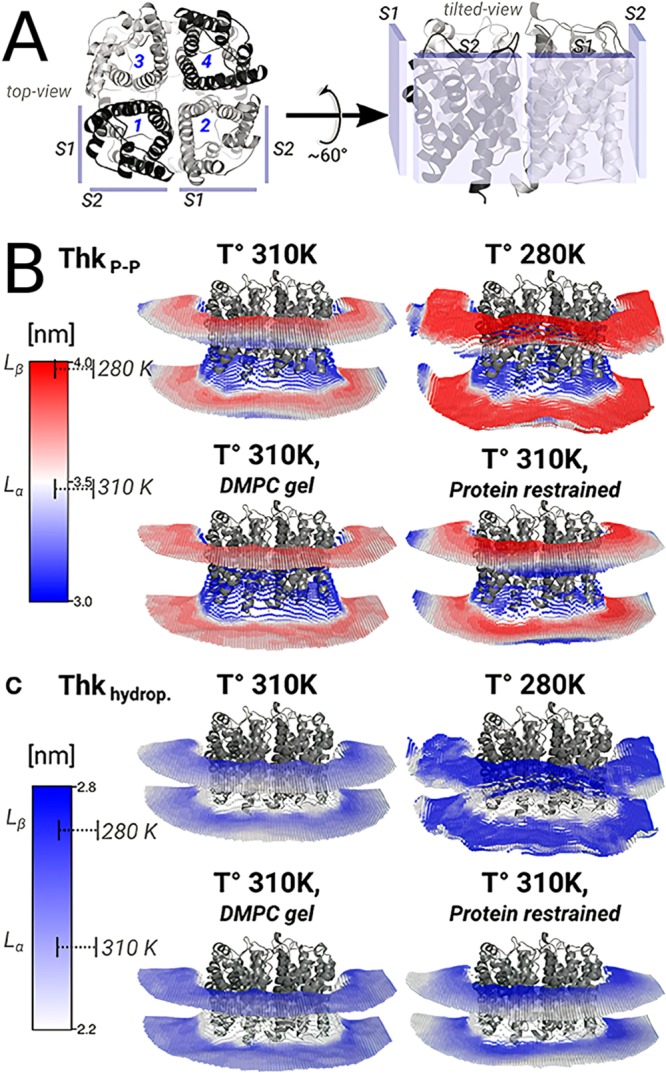
Figure 29.

Membrane thickening near the AQP0 surface. (A) AQP0 monomers from the top and side views. (B) Average interphosphate thickness (ThkP–P) and (C) average hydrophobic distance (Thkhydrop) around AQP0 tetramer. The average ± standard deviation of the thickness values for a pure DMPC bilayer at 310 K (fluid-phase, Lα) and at 280 K (gel-phase, Lβ) are indicated on the color bars. Reprinted from ref (752). Copyright Briones et al. (https://creativecommons.org/licenses/by/4.0/legalcode).
