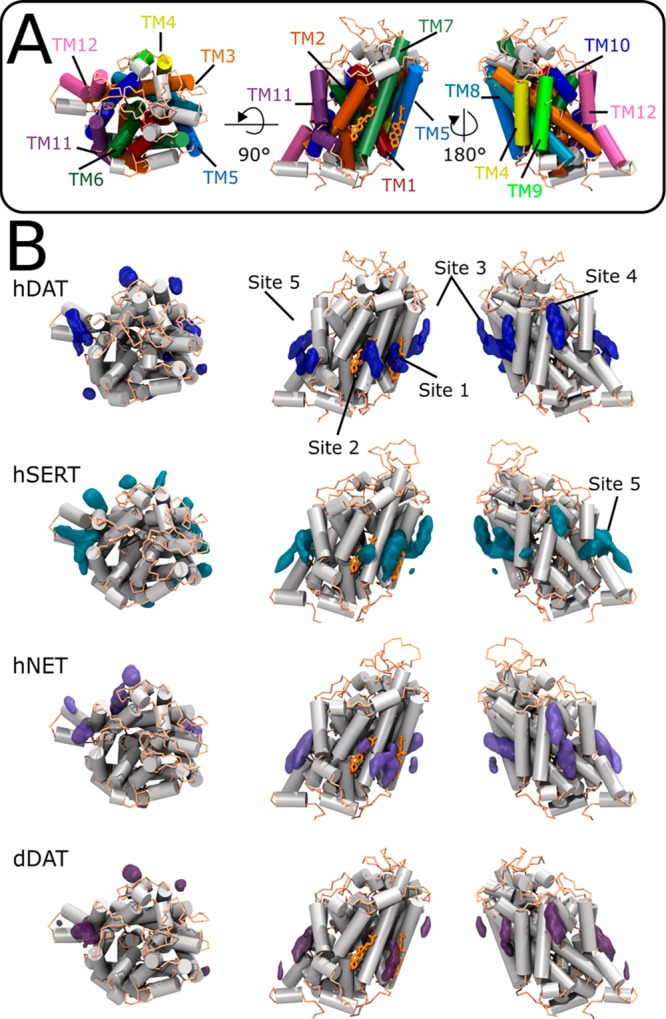
Figure 31.

Annular cholesterol-binding sites on various monoamine transporters (MATs). (A) The cartoon representation of hDAT from the top (left) and the side views (center and right). The two cocrystallized cholesterol molecules are shown in orange licorice representation. (B) Cholesterol occupancy isosurfaces are shown for various MATs shown from the top (left) and side views (center and right). Cholesterol in 5 conserved sites is depicted in orange licorice. Reprinted from with permission from ref (817). Copyright 2018 Zeppelin et al. (https://creativecommons.org/licenses/by/4.0/legalcode)
