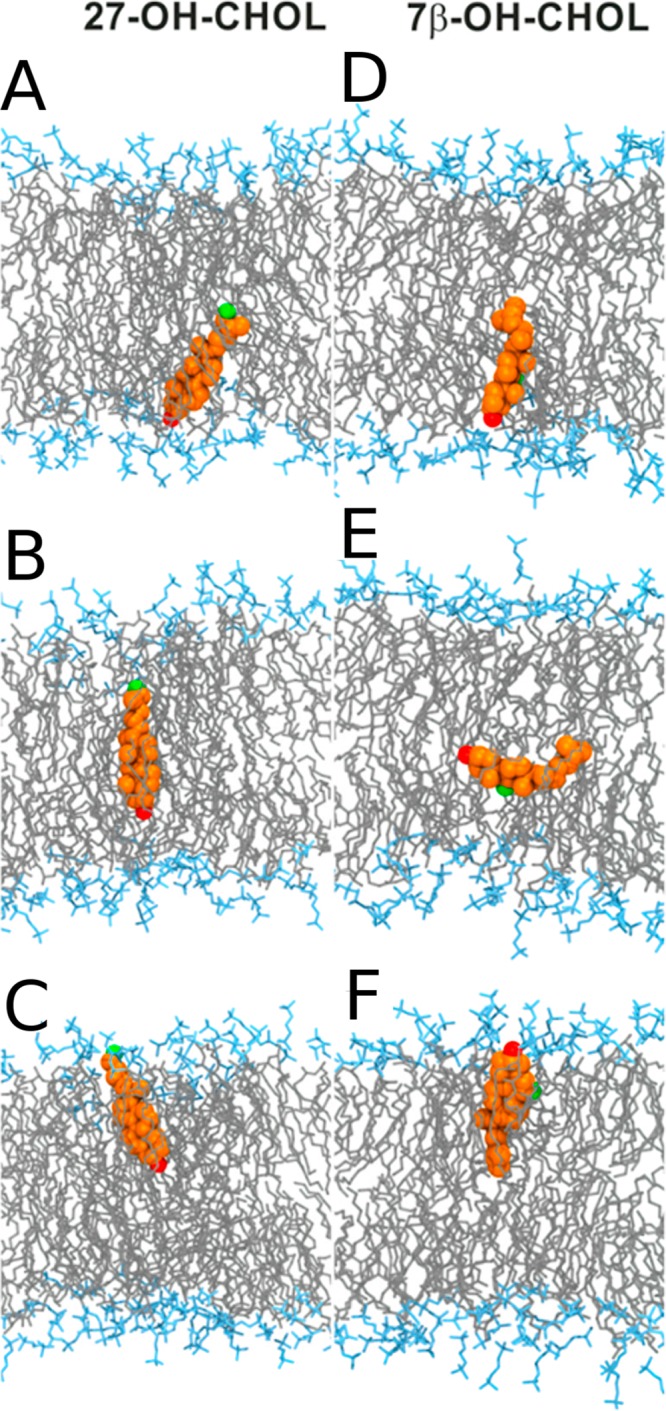
Figure 39.

Snapshots from the MD simulation showing the translocation process of (A–C) 27-hydroxycholesterol and (D–F) 7β-hydroxycholesterol across a membrane. Shown here are the 7β- and 27-hydroxyl groups (green), the 3β-hydroxyl group (red), the oxysterol ring/tail structures (orange), the POPC headgroup (cyan), and lipid chains (gray). Reproduced with permission from ref (164). Copyright 2018 American Chemical Society.
