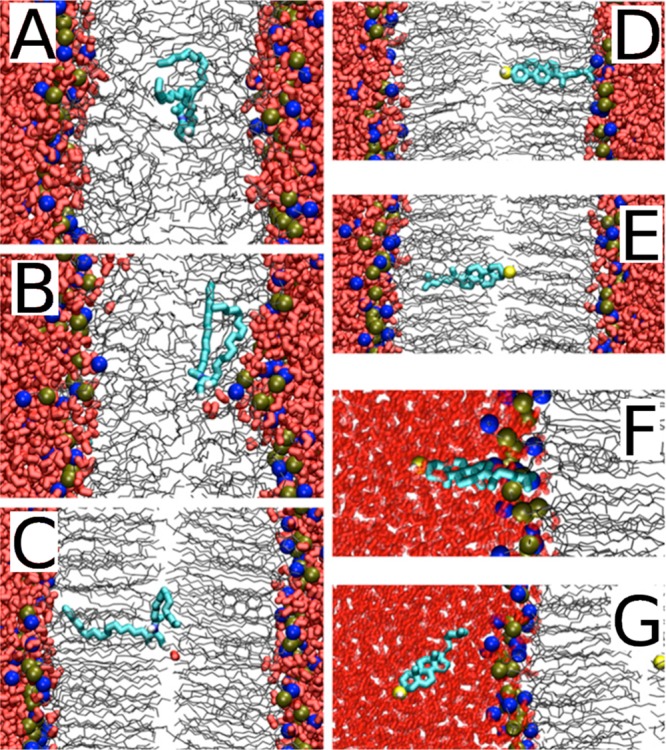
Figure 41.

Snapshots from the MD simulation showing the translocation of ceramide and cholesterol in model membranes. In the snapshots, water is shown in red thick licorice, lipid chains in gray lines, and phosphorus and nitrogen atoms in tan and blue balls. The restrained ceramide or cholesterol are thick cyan lines, and the oxygen of the restrained cholesterol is a yellow ball. Reproduced with permission from ref (979). Copyright 2012 the American Society for Biochemistry and Molecular Biology, Inc.
