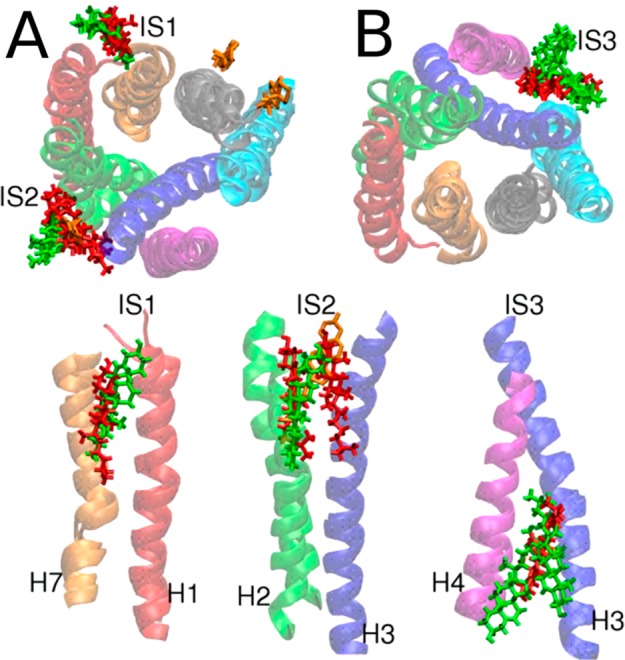
Figure 44.

Predicted cholesterol-binding sites. (A, top panel) Cholesterol in the extracellular leaflet shown from the top. (B, top panel) Cholesterol the intracellular leaflet shown from the bottom. (bottom panels) Side views showing the positions of the cholesterols for each interaction site. The cholesterols resolved in the high-resolution structure of Liu et al.1034 are shown as orange sticks. Reproduced with permission from ref (1029). Copyright 2012 American Chemical Society.
