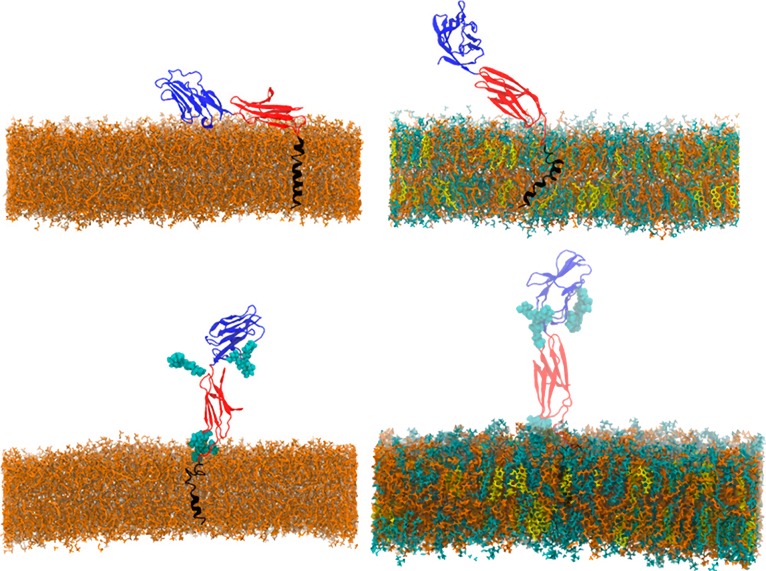
Figure 51.
Simulation snapshots of nonglycosylated CD2 in (top, left) Ld and (top, right) Lo bilayers and of glycosylated CD2 in (bottom, left) Ld and (bottom, right) Lo bilayers. Color code: DOPC (orange), cholesterol (yellow), SM (cyan), CD2 domain 1 (dark blue), CD2 domain 2 (red), CD2 transmembrane helix (black), and lipid carbohydrate chains (light blue). The glycosylated protein structure was prepared with the DoGlycans tool.1077 Reproduced with permission from ref (1076). Copyright 2017 American Chemical Society (https://creativecommons.org/licenses/by/4.0/legalcode).

