
Figure 54.
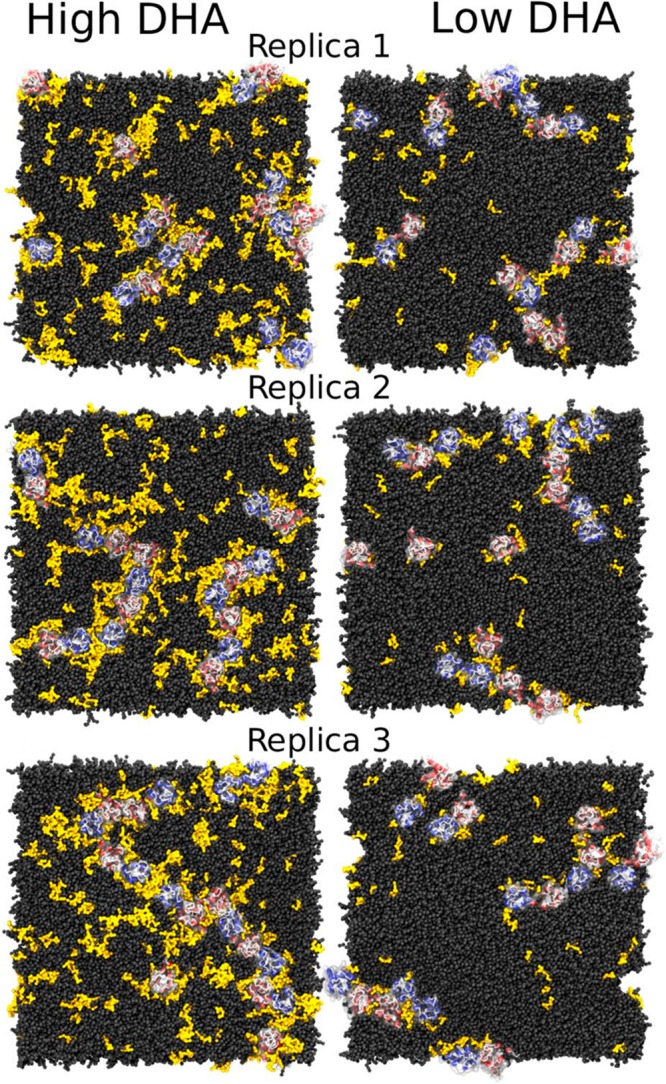
GPCR aggregation in high and low DHA membranes. Snapshots of (left) healthy (high DHA) and (right) disease-like (low DHA) systems after 60 μs of CG-MD simulation. Reproduced with permission from ref (57). Copyright 2016 Guixà-González et al. (https://creativecommons.org/licenses/by/4.0/legalcode).