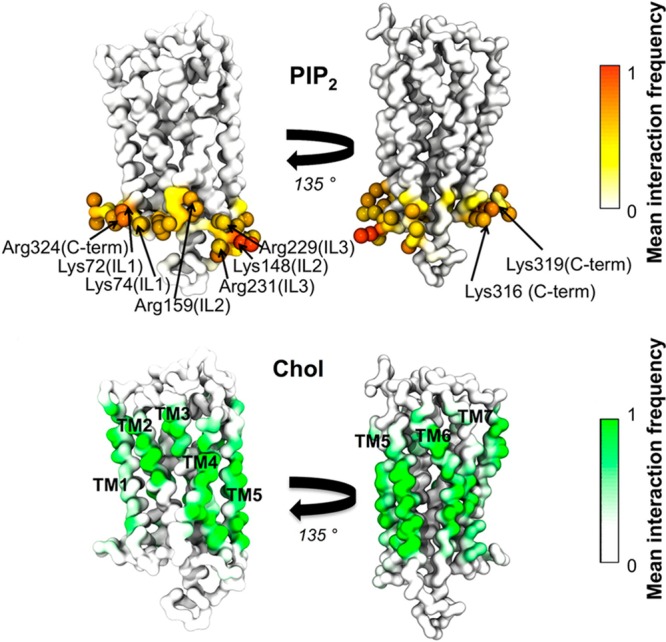
Figure 55.

Protein–lipid interactions in the GPCR system. The color scale shows the mean fraction of time there is an interaction with all 144 repeats of the S1P1 receptor. (top) Interactions between the phosphoryl headgroup of PIP2 and the receptor. (bottom) Interactions between the cholesterol molecule and the S1P1 receptor. Reproduced with permission from ref (56). Copyright 2015 American Chemical Society.
