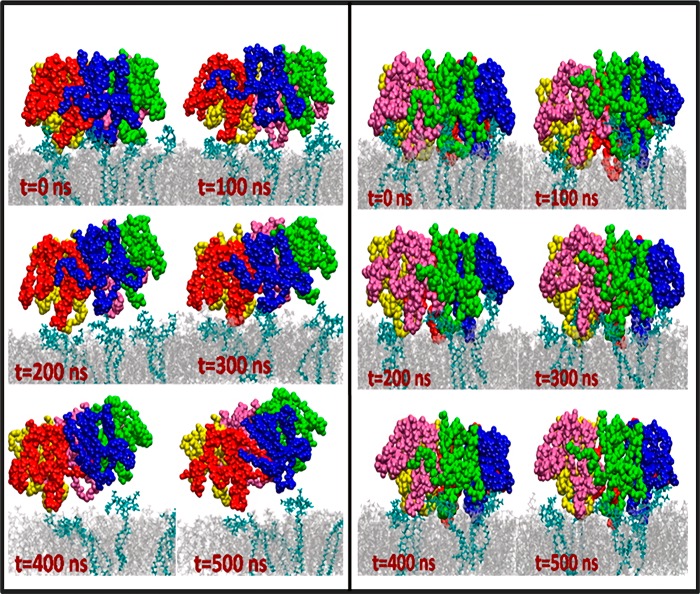
Figure 63.
Snapshots from the MD simulations depicting (left) the CT-monolayer and (right) the mutated-LT1-monolayer systems. POPC and GM1 molecules are shown as silver lines and cyan bonds, respectively. Individual subunits such as B1, B2, B3, B4, and B5 are presented separately as red, blue, green, mauve, and yellow spheres, respectively. Reproduced with permission from ref (1194). Copyright 2014 American Chemical Society.

