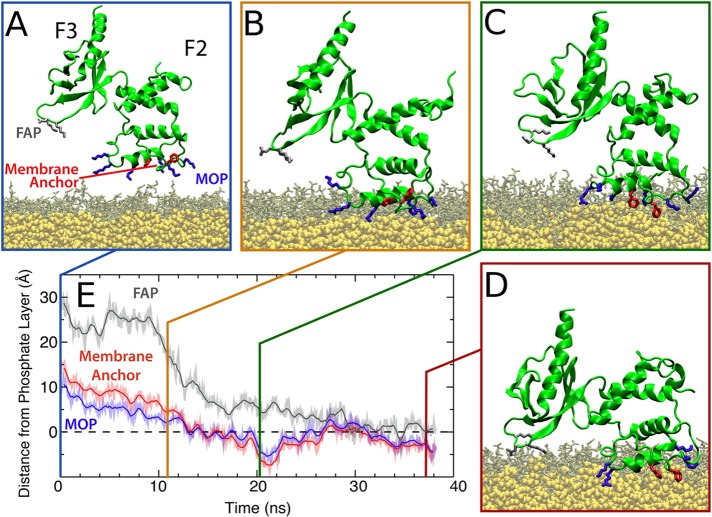
Figure 64.
Membrane binding modes of talin F2F3. (A) Initial configuration of the talin F2F3 (green cartoon). (B–D) The three distinct stages in talin interactions with lipid membrane. (E) The C-α center of mass trajectory of each membrane binding moiety (i.e., MOP, FAP, and membrane anchor) projected onto the membrane normal. The dashed line indicates the average position of the upper leaflet phosphate moieties. Reproduced with permission from ref (1196). Copyright 2014 Biophysical Society. Published by Elsevier Inc.

