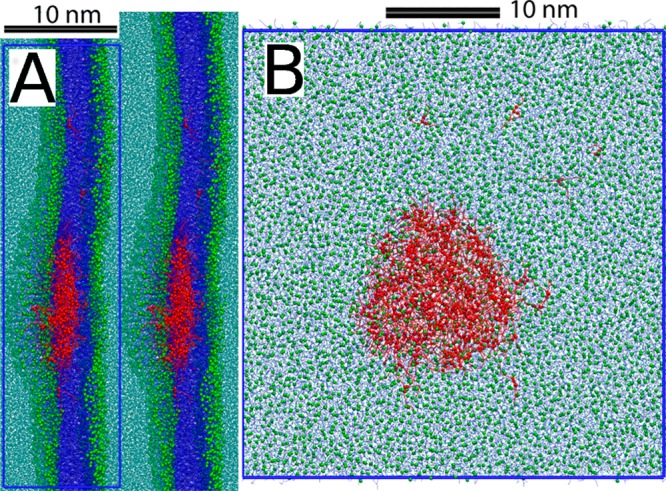
Figure 65.

Formation of a blister of about 17 nm diameter due to TO aggregation captured in the simulations (A) from the side view and (B) from the top view. Reproduced with permission from ref (1218). Copyright 2010 Khandelia et al. (https://creativecommons.org/licenses/by/4.0/legalcode).
