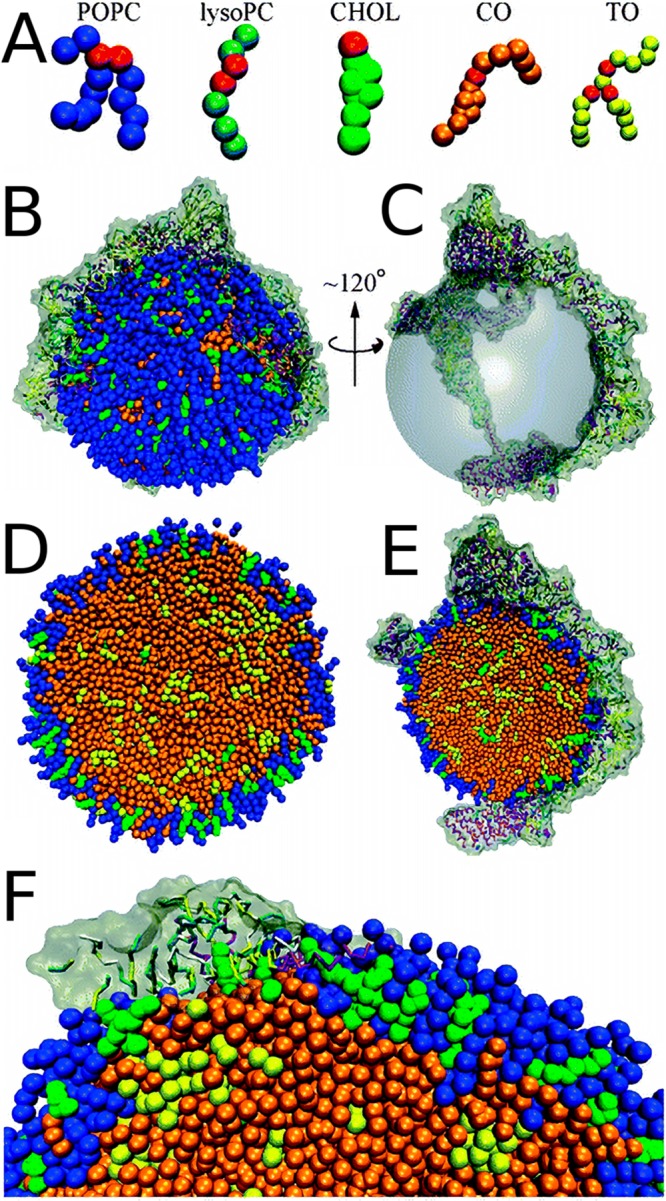
Figure 66.

Spherical LDL model by Murtola et al.1225 (A) CG lipid models used in the simulations of LDL with glycerol moieties shown in red. (B) The full LDL model with ApoB-100 in tan. (C) The lipid core in the configuration in panel B is replaced with a transparent sphere to highlight the position of apoB-100. (D) Cross section of protein-free LDL. (E) Cross section of configuration shown in panel B. (F) The zoomed in surface of the configuration shown in panel B. Adapted with permission from ref (1225). Copyright 2011 the Royal Society of Chemistry.
