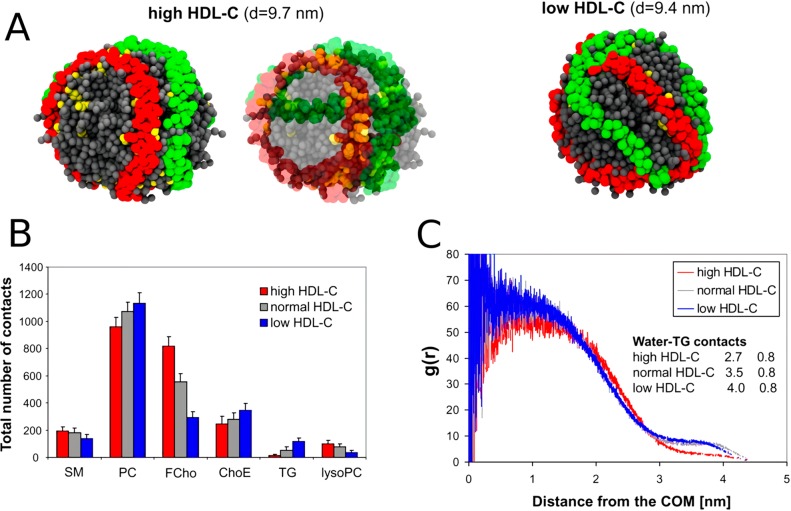
Figure 68.
SHDL models based on the lipid compositions of subjects with different levels of HDL and the CG simulations. (A) The CG simulation snapshots after 8 μs equilibration. ApoA-I proteins are shown in red and green, cholesterol in yellow, and other lipids in gray. Waters are not shown for clarity. The localization of cholesterols near apoA-I in the high HDL-C case is visible in the second panel from the left. (B) Unnormalized number of contacts between apoA-Is and lipids. The errors bars denote the standard deviation. (C) Radial distribution function of TG molecules around the center of mass of the HDL particle. The inset shows the average number of water contacts of TG. Reproduced with permission from ref (1254). Copyright 2010 the American Society for Biochemistry and Molecular Biology.

