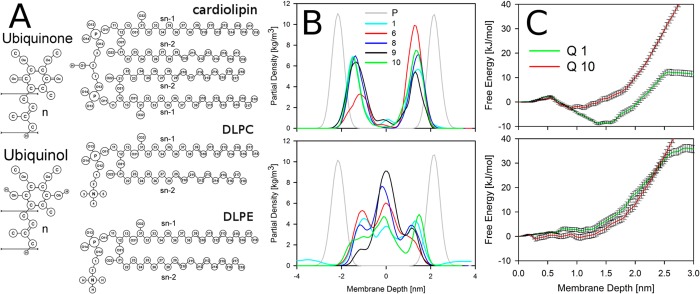
Figure 69.
Dynamics and distribution of quinones and quinols in the membrane. (A) The chemical structures of (left) ubiquinone (oxidized Q, Qox) and ubiquinol (reduced and protonated Q, QH2), where n indicates the variable isoprenoid chain lengths; (right, top to bottom) cardiolipin, DLPC, and DLPE. (B) Density profiles of (top) QH2 and (bottom) Qox for different isoprenoid chain lengths. The density of phosphorus atoms of DLPC is shown in gray. (C) Free energy profiles for (top) QH2 and (bottom) Qox along the membrane normal for quinone with 1 and 10 isoprene monomers. The origin is set to the center of mass of the membrane. Adapted with permission from ref (1281). Copyright 2016 Elsevier.

