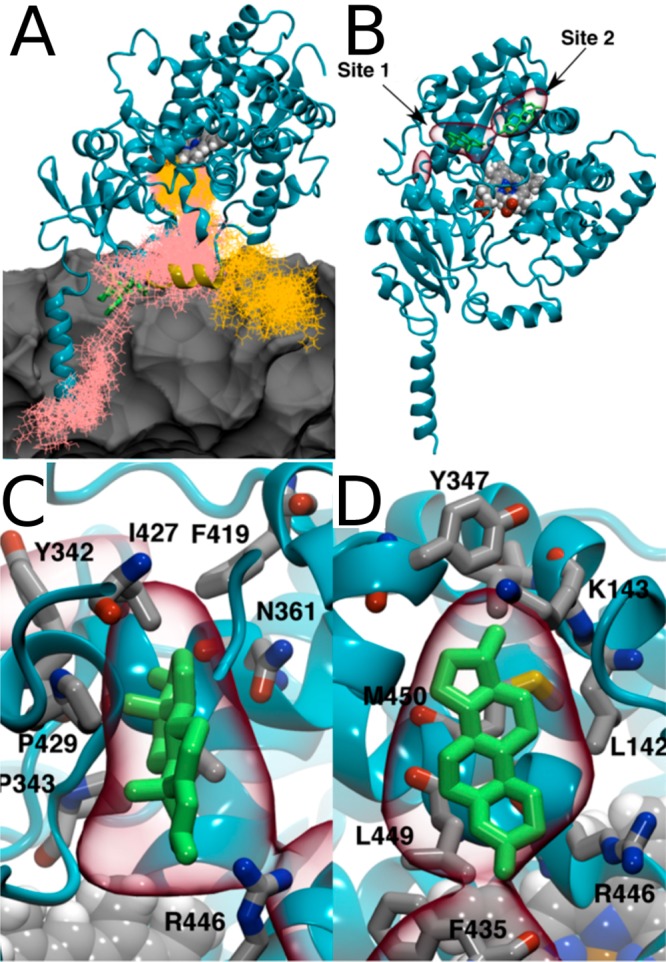
Figure 71.

Snapshots of two testosterone molecules (pink and orange) in the windows prior to their docking into the catalytic pockets. Lipids are shown as a gray surface (A). Location of testosterone binding sites (B) and their close views (C, D) with volumetric maps (red lines) highlighting the highest testosterone mass-weighted density over 25 μs of a MD simulation. Representative testosterone configurations are shown in green stick representation. Reproduced with permission from ref (1327). Copyright 2018 the American Society for Biochemistry and Molecular Biology.
