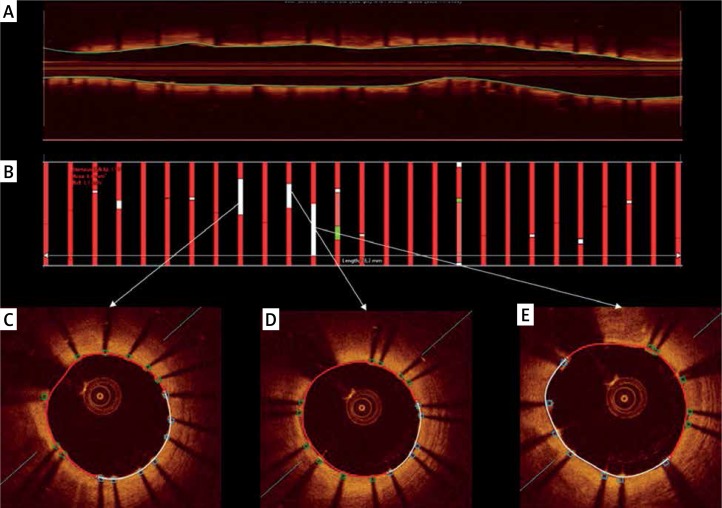
Figure 2.
Representative images of O-ZES surface area analysis. A – Cross-sectional image of the implanted stent. B – Boxes indicate the 1 mm intervals of surface measurements. Red color indicates covered struts, other color indicates uncovered struts. C, D, E – Representative images of study stent with lumen surface (white line) covered with uncovered struts (blue boxes)

