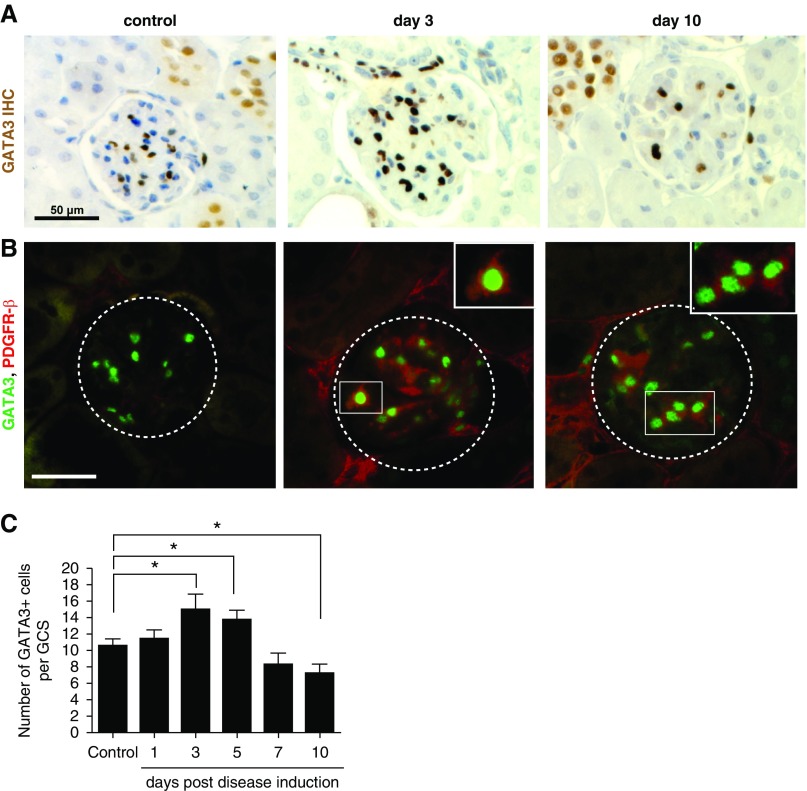
Figure 6.
Glomerular expression of GATA3 in mice induced with nephrotoxic nephritis. (A) IHC for GATA3 (brown) in kidney sections of mice that were administered nephrotoxic antibodies to induce nephritis by days 3 and 10; and in corresponding control mice. Scale bar, 50 µm. (B) Co-IF with anti-GATA3 (green) and anti–PDGFR-β (red) antibodies demonstrating an increase in GATA3 IF signal in MCs coexpressing PDGFR-β at day 3 post disease induction (boxed region). Scale bar, 50 μm. (C) Quantification of the number of GATA3-expressing nuclei within a GCS area (n≥20) reveals an increase in GATA3+ MC number on the third and fifth day post disease induction, and a reduction in the number of GATA3+ cells by day 10. *P<0.05.

