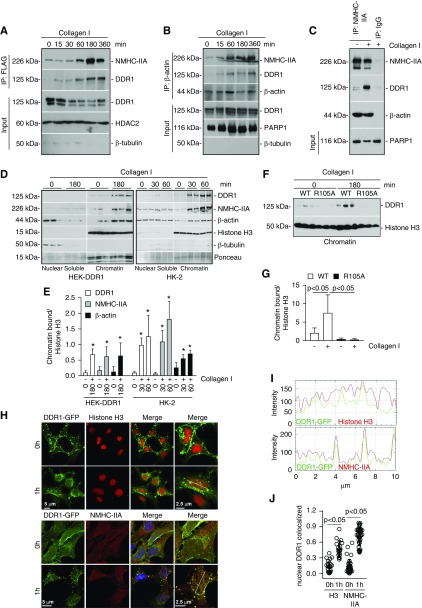
Figure 6.
DDR1, NM IIA, and β-actin exist as a nuclear complex in chromatin fractions. (A) Serum-starved HEK cells transfected with DDR1-FLAG cDNA were treated with collagen I (50 µg/ml) for the times indicated. Time 0 represents cells incubated with 20 mM acetic acid for 360 minutes. Nuclear lysates (200 µg) were immunoprecipitated with anti-FLAG antibody and the immunoprecipitates were analyzed by western blot for levels of NMHC-IIA and DDR1. Input represents non-nuclear lysates (20 µg/lane) analyzed for total levels of DDR1, or nuclear lysates analyzed for total levels of HDAC2 (nuclear marker) and β-tubulin (cytoplasmic marker). (B) Serum-starved HEK-DDR1 cells were treated as in (A). Nuclear lysates (200 µg) were immunoprecipitated with anti–β-actin antibody and the immunoprecipitates were analyzed by western blot for levels of NMHC-IIA, DDR1, and β-actin. Input represents non-nuclear lysates (20 µg/lane) analyzed for total levels of DDR1, or nuclear lysates analyzed for total levels of PARP1 and β-tubulin. (C) To verify specificity of the immunoprecipitation, serum-starved HEK-DDR1 cells were treated with vehicle and collagen I for 3 hours. Nuclear lysates (200 µg) were immunoprecipitated with anti–NMHC-IIA or IgG control and the immunoprecipitates were analyzed by western blot for levels of NMHC-IIA, DDR1, and β-actin. Input represents nuclear lysates (20 µg/lane) analyzed for levels of PARP1. (D) Serum-starved HEK-DDR1 cells or HK-2 cells were treated with collagen I (50 µg/ml) for the times indicated. Time 0 represents cells incubated with 20 mM acetic acid for 60 or 180 minutes. Nuclei were separated into nuclear soluble and chromatin fractions which were analyzed by western blot (20 µg/lane) for levels of DDR1, NMHC-IIA, β-actin, and histone H3. (E) Chromatin-bound DDR1, NMHC-IIA, β-actin, and histone H3 bands in HEK-DDR1 or HK-2 cells were quantified by densitometry. Values represent DDR1/, NMHC-IIA/, or β-actin/histone H3 ratio and are the mean±SD of three experiments. (F) Serum-starved HEK-DDR1 and HEK-DDR1-R105A cells were treated with collagen I (50 µg/ml) for the times indicated. Chromatin-bound fractions (20 µg/lane) were analyzed by western blot for level of DDR1 and histone H3. (G) Chromatin bound DDR1 and histone H3 bands were quantified by densitometry. Values represent DDR1/histone H3 ratio and are the mean±SD of two experiments performed in triplicate. (H) Confocal images of serum-starved HEK-DDR1-GFP cells treated with collagen I (50 µg/ml) for 0 or 1 hour and stained with anti-histone H3 (left panel) or anti–NMHC-IIA (right panel) antibodies. Time 0 represents cells incubated with 20 mM acetic acid for 3 hours. (I) Line scanning profile showing intensity of DDR1-GFP and histone-3 or NMHC-IIA pixels, measured along the white line in (E). (J) The degree of nuclear colocalization between DDR1 and histone H3 or NMHC-IIA was performed using Manders’ coefficient. Circles represent single cells, whereas the bars represent the mean±SD.

