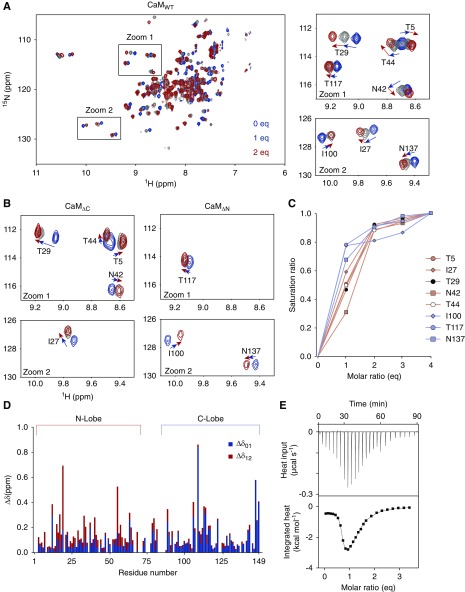
Figure 2.
NMR and ITC titrations of CBDp binding to Ca2+CaM. (A) Overlay of 2D 1H-15N SOFAST-HMQC spectra of 13C, 15N–labeled CaM with increasing amounts of nonlabeled CBDp. The right panels show zoomed views of crosspeaks (NMR signals). T5, I27, T29, N42, and T44, which are residues within the N-lobe of CaM, showed nonlinear direction changes during the titration. (B) Zoomed view of 2D 1H-15N SOFAST-HMQC spectra of 13C, 15N–labeled CaMΔC and CaMΔN with the increasing amounts of nonlabeled CBDp. The color code is the same as in (A). In contrast to CaMWT, signals of all residues shifted in a linear manner. (C) Saturation of NMR signal shift changes as a function of the equivalent molar ratio of added CBDp. Each value (Δδij) was divided by Δδtotal (=Δδ01+Δδ12+Δδ23+Δδ34) to yield the saturation ratio. All residues reached 80%–90% of saturation at 2 eq. (D) Combined CSPs upon addition of CBD were plotted as a function of the residue number of CaM. In stacked bar graph, Δδ01 (blue) and Δδ12 (red) represent CSPs from 0 to 1 eq and from 1 to 2 eq, respectively. (E) ITC thermograms for CBD binding of CaMWT in the presence of Ca2+. Upper panel represents the raw data for sequential injections of CBDp into CaM. In the lower panel, the data points are obtained by integration of the peaks in the upper panel and plotted against the molar ratios. Fitting was performed with two-site binding model to determine thermodynamic parameters and binding affinity. ITC data for CaMΔC, CaMΔN are shown in Supplemental Figure 3 and summarized in Supplemental Table 2.

