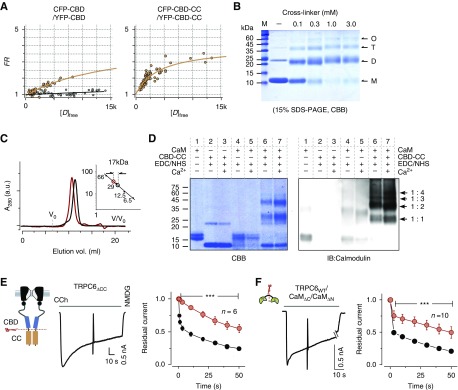
Figure 3.
Assembly of coiled-coil segments and their functional role. (A) FRET measurement of binding strength comparison between CBDs (left panel) and CBD-CC segments (right panel) in live cells. The binding affinity was evaluated by the same analysis style as in Figure 1D. A negative control (CFP and YFP only) for FRET measurements is shown in the panel for CBD only (gray circles). (B) Crosslinking of CBD-CC fragments. Purified CBD-CC (200 μM) was treated with 0–3 mM EGS crosslinker. Arrows indicate monomer (M, 11.6 kDa), dimer (D), tetramer (T), and oligomer (O) formations of CBD-CC. (C) Size exclusion chromatography results for CBD-CC with and without CaM are shown as red and black traces, respectively. The inset shows the standard curve estimation of the complex sizes of CBD-CC with and without CaM. (D) Crosslinkings of CaM to CBD-CC by EDC/NHS (1 mM) in the presence (1 mM) or absence of Ca2+ were separated in SDS-PAGE and were imaged by CBB stain (left), or immunoblotting for CaM (right). The positions of the expected mol wt for single CaM (16.7 kDa) and single or multiple CBD-CC complexes (1:1, 1:2, 1:3, 1:4) are indicated by arrows. (E) Currents from TRPC6 with a truncated coiled-coil (TRPC6ΔCC), evoked by CCh. Inactivation plots constructed by plotting residual currents against time for TRPC6WT and TRPC6ΔCC are shown as black and red circles, respectively. (F) Representative TRPC6 currents trace from the cell cotransfected with the N-lobe (CaMΔC) and C-lobe (CaMΔN). Residual current plots of CaMΔC/CaMΔN (red circles) versus TRPC6WT without overexpression of CaM (CaMendo) (black circles). Data from CaMΔC or CaMΔN only are shown in Supplemental Figure 5.

