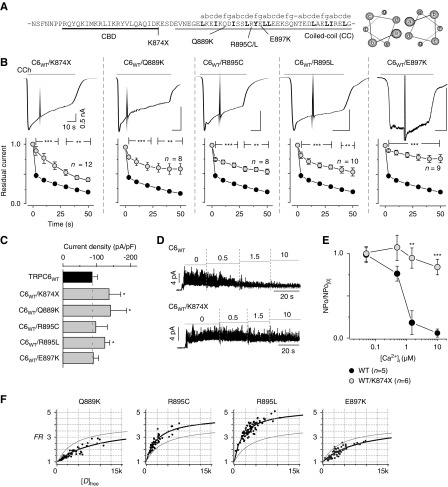
Figure 4.
FSGS mutations in the coiled-coil segment lead to impairment of CDI. (A) The sequence of the locus of the CBD (black) and coiled-coil segment (gray), and FSGS mutations within the TRPC6 channel. Positions of the coiled-coil heptad repeat (abcdefg) are indicated above the sequence. Helical-wheel diagrams showing the location of residues in the heptad repeat (right). (B) Receptor-activated whole-cell currents from FSGS mutations (TRPC6K874×, TRPC6Q889K, TRPC6R895C, TRPC6R895L, TRPC6E897K) coexpressed with wild-type TRPC6 in HEK293 cells (upper panels). Scale bars depict the same time course and current amplitude throughout. The coexpression of wild-type and K874× mutation showed no difference compared with K874× alone (Supplemental Figure 6). Residual current plots are plotted against time after the peak (data from FSGS-associated TRPC6 channels are shown in gray circles, lower panels). (C) Summary of the peak current densities (pA/pF) induced by the receptor stimulation. (D) Inside-out recordings of TRPC6WT (upper), TRPC6K874× (lower) with step-wise changing of intracellular Ca2+ concentrations (μM). (E) Summary of the inside-out recordings. TRPC6WT (black circles) and TRPC6K874× (gray circles) are represented as a plot of normalized NPo versus [Ca2+]i. Normalized NPo was obtained by dividing NPo at nearly zero [Ca2+]i. (F) Binding affinities between CBD-CC mutants in cells were measured by FRET, where individual data points represent FRET strength from single cells (black circles), and fitted by using 1:1 binding isotherm equations (black curve). The strength of interaction of CBD-CCWT is shown as a gray line (control). FRET data are summarized in Supplemental Table 1.

